Cryptocurrency-Analysis
所属分类:加密货币
开发工具:Jupyter Notebook
文件大小:287150KB
下载次数:2
上传日期:2022-02-07 16:40:49
上 传 者:
sh-1993
说明: 加密货币分析
(Cryptocurrency Analysis)
文件列表:
Crypto_Scrape (0, 2022-02-08)
Crypto_Scrape\crypto_scrape.ipynb (4004, 2022-02-08)
Dashboard (0, 2022-02-08)
Dashboard\CryptoCurrency.twb (665777, 2022-02-08)
Dashboard\CryptoCurrency.twbx (16168766, 2022-02-08)
Dashboard\Dashboard.md (1368, 2022-02-08)
Dashboard\Seg3_LaviJ (0, 2022-02-08)
Dashboard\Seg3_LaviJ\app.py (859, 2022-02-08)
Dashboard\Seg3_LaviJ\assets (0, 2022-02-08)
Dashboard\Seg3_LaviJ\assets\css (0, 2022-02-08)
Dashboard\Seg3_LaviJ\assets\css\LineIcons.3.0.css (26932, 2022-02-08)
Dashboard\Seg3_LaviJ\assets\css\animate.css (67470, 2022-02-08)
Dashboard\Seg3_LaviJ\assets\css\bootstrap.min.css (205325, 2022-02-08)
Dashboard\Seg3_LaviJ\assets\css\glightbox.min.css (13884, 2022-02-08)
Dashboard\Seg3_LaviJ\assets\css\main.css (48768, 2022-02-08)
Dashboard\Seg3_LaviJ\assets\css\tiny-slider.css (2096, 2022-02-08)
Dashboard\Seg3_LaviJ\assets\fonts (0, 2022-02-08)
Dashboard\Seg3_LaviJ\assets\fonts\LineIcons.eot (139176, 2022-02-08)
Dashboard\Seg3_LaviJ\assets\fonts\LineIcons.svg (590766, 2022-02-08)
Dashboard\Seg3_LaviJ\assets\fonts\LineIcons.ttf (139004, 2022-02-08)
Dashboard\Seg3_LaviJ\assets\fonts\LineIcons.woff (76341, 2022-02-08)
Dashboard\Seg3_LaviJ\assets\fonts\LineIcons.woff2 (62480, 2022-02-08)
Dashboard\Seg3_LaviJ\assets\images (0, 2022-02-08)
Dashboard\Seg3_LaviJ\assets\images\favicon.svg (1260, 2022-02-08)
Dashboard\Seg3_LaviJ\assets\images\features (0, 2022-02-08)
Dashboard\Seg3_LaviJ\assets\images\features\feature-icon-1.png (5428, 2022-02-08)
Dashboard\Seg3_LaviJ\assets\images\features\feature-icon-2.png (5683, 2022-02-08)
Dashboard\Seg3_LaviJ\assets\images\features\feature-icon-3.png (6362, 2022-02-08)
Dashboard\Seg3_LaviJ\assets\images\hero (0, 2022-02-08)
Dashboard\Seg3_LaviJ\assets\images\hero\h2-bit-l.png (24102, 2022-02-08)
Dashboard\Seg3_LaviJ\assets\images\hero\h2-bit-m.png (11662, 2022-02-08)
Dashboard\Seg3_LaviJ\assets\images\hero\h2-bit-s.png (6455, 2022-02-08)
Dashboard\Seg3_LaviJ\assets\images\hero\hero-shape.svg (534, 2022-02-08)
Dashboard\Seg3_LaviJ\assets\images\hero\home2-bg.png (31853, 2022-02-08)
Dashboard\Seg3_LaviJ\assets\images\hero\text-shape.svg (998, 2022-02-08)
Dashboard\Seg3_LaviJ\assets\images\logo (0, 2022-02-08)
Dashboard\Seg3_LaviJ\assets\images\logo\logo.svg (5018, 2022-02-08)
Dashboard\Seg3_LaviJ\assets\images\logo\white-logo.svg (5312, 2022-02-08)
... ...
# Cryptocurrency Analysis
Use machine learning, R, Python, and Tableau to analyze and forecast popular cryptocurrencies and to analyze trends within the decentralized finance (DeFi) marketplace.
## Project Dashboard
Link to Tableau dashboard [here](https://public.tableau.com/app/profile/jackie.guo1187/viz/CryptoCurrency_1***35453604390/CryptoCurrency#1)
## Project Links
Link to Webpage [here](https://lavexplorer.wixsite.com/its-crypto)
Google Slides presentation [here](https://docs.google.com/presentation/d/1B-afhhAZLpZWEUXa2ecDp3Q4k_lRqWVCoqEJYYf4YnM/edit?usp=sharing)

## Overview
Cryptocurrency, a form of decentralized digital money based on blockchain technology has gained lot of popularity in the past few years. As crypto is a highly speculative investment with the potential for intense price fluctuations, experts hold mixed opinions about investing in cryptocurrencies.
As of Nov. 26, 2021, the combined market value of the world's bitcoins totaled over 1.03 trillion and the global market price of a single bitcoin was $54,572. (Ref: Investopedia) and the market keeps growing.
Following are the top 10 Cryptocurrencies (Ref: Forbes) :

Global adoption of cryptocurrency has taken off in the last year, up 881%, with Vietnam, India and Pakistan firmly in the lead, according to new data from Chainalysis.(Ref: CNBC)
As per triple A, between 2012 and 2021, the price of Bitcoin has increased by over 540,000% and has reached an annual growth of 274% in 2020 and the cryptocurrency market is predicted to grow with an annual growth rate of 5***% from 2019 to 2025.
Cryptocurrency across industries (Ref: Triple A) clearly proves the growing popularity of cryptocurrencies.
1. Up to 40% of customers pay with cryptocurrency.
2. Number of transactions paid with crypto on e-commerce sites grow by 12.5% every year.
3. Merchants who accept crypto payments saw an average ROI of 327%
4. Digital remittances and cross-border transfers reached almost US$95.96 billion in 2020.
5. Crypto remittance is 388 times faster and 127 times cheaper than traditional remittance methods.
6. 58% cryptocurrency owners are aged under 34.
Following are the top 5 countries that have the highest number of crypto owners*Ref: Triple A) :
1. India (100 million)
2. USA (27 million)
3. Nigeria (13 million)
4. Vietnam (5.9 million)
5. United Kingdom (3.3 million)
## Purpose of the Project
Considering the above popularity, it's likely the crypto market will keep growing. In order to predict the future of crytocurrency, it's important to consider factors that impact the prices of the cryptocurrencies (Ref: ).
1. **Supply & Demand**: This is one of the main factors influencing the price of the cryptocurrency. Just like an demand and supply cycle, if the demand is high as compared to the supply. the higher the price and vice versa.
2. **Cost of Extraction(Mining)**: Crytocurrencies are extracted using an intense amount of computer power and electricity. It’s estimated that 0.21% of all of the world’s electricity goes to powering Bitcoin farms.
3. **Rules & Regulations**: If the rules or requirements introduced by national authorities, become quite restrictive or take the form of repression, the price of the cryptocurrency may fall.
4. **Power of the Media**: Just like the stock market, good news can certainly increase it, while bad news can cause panic, which leads to a quick escape of investors from the market and rapid falls.
5. **Financial Crises**: Depends on the economic situation in the concerned countries, If the traditional financial system starts to collapse, people panicly run in other assets.
6. **Celebrity Impact** ([Ref](https://www.trality.com/blog/how-does-cryptocurrency-gain-value)):
A cryptocurrency’s ability to gain value can be helped (or hindered) by stardom. Elon Musk, Jack Dorsey, Mike Tyson, Maisie Williams, Mark Cuban, Snoop Dogg, Steven Seagal, Kanye West, Floyd Mayweather Jr., and Richard Branson are just a handful of celebrity holders of the now famous coin, spanning the worlds of sport, film, music, and business.
## Selected Cryptocurrencies for this Analysis:
1. Binance Coin (BNB)
2. Bitcoin (BTC)
3. Cardano (ADA)
4. Dogecoin (DOGE)
5. Ethereum (ETH)
6. Litecoin (LTC)
7. Monero (XMR)
8. Stellar (XLM)
9. Tether (USDT)
10. XRP (XRP)
## Project Questions to Answer
The following key questions are addressed through this analyis:
1. What is the average age of the top 10 coins by marketcap?
2. Which currencies are the most volatile?
3. Which currencies are the most stable?
4. Using machine learning, can we predict the close price of the 10 selected cryptocurrencies?
5. What is the rate of fluctuations in the prices of the cryptocurrencies in x amount of time?
6. How do cryptocurrencies compare to the broader market?
## Tools Used in the Analysis
As there are many factors that influence the price of the cryptocurrencies, in this analysis we are using the following technology and tools:
**For Data Preprocessing:**
1. Google Colab, Jupyter Notebook
2. Python
3. Libraries: Pandas, NumPy, Matplotlib
**For Data Storage:**
1. MongoDB
**For Machine Learning:**
1. TensorFlow, Keras
2. Bidirectional Long Short-Term Memory Model
3. Sentiment Analysis using Textblob
4. Prophet (in R)
**For the Presentation:**
1. Tableau
2. Flask
3. Webpage using Wix, HTML, CSS
We are also extracting information from various social media sites that contain any comments by celebrities or whales(highest buyers of cryptocurrencies) and run a sentiment analysis to enhance our prediction.
## Meet the Team :
Lavina Jagwani
Jordan Levy
Robert Yokabaskas
Yutai Lee
Richard Barber
Jacqueline Guo
## Psuedocode for the Project
1. Selecting the dataset
2. Preprocessing the database -
a. Removing all null values
b. Removing all irrelevant columns like (name and index no., etc)
c. Bucketing
d. Running one-hot encoder and creating a new dataframe
3. Connecting to the provisional database
4. Training the model
5. Using LSTM Bidirectional Layers and a Dense Activation Layer
6. Changing the number of epochs on the models
7. Storing the results on the database
8. Creating visualizations using Tableau and a webpage using HTML, CSS or bootstrap.
## Description of the Source Data
The data we have gathered is from Kaggle and Data World. The historical cryptocurrency data from Kaggle includes: coin name, symbol, date, high, low, open, close, volume, marketcap. The same metrics were also recorded in the ‘S&P 500 Historical Data’ csv file from Kaggle. The csv files from Data World include common finance metrics for cryptocurrencies, including: coin name, symbol, marketcap, price, volume.
The historical trading data is included for the following coins:
Binance Coin
Bitcoin
Cardano
Dogecoin
Ethereum
Litecoin
Monero
Stellar
Tether
XRP
## Technology Usage Plan (Role X by Jordan)
#### Data Cleaning and Analysis
Python and Pandas will be used to clean the data and perform an exploratory analysis. Further analysis will be completed in Python utilizing dependencies including but not limited to Pandas, NumPy, matplotlib, json. If we have enough time for a sentiment analysis, then Textblob will be used. Additional seasonal trading analysis will be done using Prophet in R.
#### Database Storage
We intend to use MongoDB. MongoDB is a non-relational database and therefore we do not need an ERD. We can connect to the database with PyMongo.
#### Machine Learning
Google Colab will be used to run the machine learning model. The Keras library from Tensor Flow will be utilized. And we plan to use a Bidirectional Long Short-Term Memory (BI-LSTM) model.
#### Dashboard
We will use Tableau to display graphs, charts, and try to tell a story with the data. Ideally, viewers will be able to interact through drop down menus within Tableau. We will also create a webpage using Wix.
## Database Segment 1 (Role: Cirlce by Yutai)
Overview
Find public resources on virtual currencies for non-profit academic research through Kaggle and Data world. We use Pandas to narrow down the data and remove some extraneous information. The preparation of these data will effectively improve the speed and accuracy of data operations, and upload these data to MongoDB.
**Data Selection**
Dataset used : https://www.kaggle.com/sudalairajkumar/cryptocurrencypricehistory
Remove unimportant information such as virtual currency names and symbols.
Reduce the time horizon to nearly five years, reduce the amount of data and improve forecast accuracy.
MongoDB
Upload the sorted data to MongoDB, so that team members can more easily obtain the latest data.
## Database Segment 2 (Lavina Jagwani)
Data Source : https://coinmarketcap.com/api/documentation/v1/#operation/getV1CryptocurrencyListingsLatest
market_cap: CoinMarketCap's market cap rank as outlined in our methodology.
market_cap_strict: A strict market cap sort (latest trade price x circulating supply).
name: The cryptocurrency name.
symbol: The cryptocurrency symbol.
date_added: Date cryptocurrency was added to the system.
price: latest average trade price across markets.
circulating_supply: approximate number of coins currently in circulation.
total_supply: approximate total amount of coins in existence right now (minus any coins that have been verifiably burned).
max_supply: our best approximation of the maximum amount of coins that will ever exist in the lifetime of the currency.
num_market_pairs: number of market pairs across all exchanges trading each currency.
market_cap_by_total_supply_strict: market cap by total supply.
volume_24h: rolling 24 hour adjusted trading volume.
volume_7d: rolling 24 hour adjusted trading volume.
volume_30d: rolling 24 hour adjusted trading volume.
percent_change_1h: 1 hour trading price percentage change for each currency.
percent_change_24h: 24 hour trading price percentage change for each currency.
percent_change_7d: 7 day trading price percentage change for each currency.
File name : Fetch_API_latest_data2.ipynb
Psuedocode :
1. Use URL and API key to fetch data in json format
2. Converted the data from json format to dataframe using json_normalize.
3. Filtered all Nan values and removed columns with null 90% values
4. Analysis :
1. Top 10 cryptocurrencies based on market cap
2. Top_total_supply_currencies_df
3. Top_circulating_supply_currencies_df
4. Top_Percent_90d_df
5. Top_Percent_60d_df
6. Top_Percent_30d_df
7. Top_Percent_7d_df
8. Top_Percent_24h_df
9. Top_Percent_1h_df
5. Make this data dynamically availble on the push of a scrape button --- WIP
1. Data Source : kaggle data historical kaggle data
Psuedocode :
1. Filtered all Nan values and removed columns with null 90% values
2. Analysis :
1. Calculate the daily, monthly and yearly fluctuation in closing and opening price
3. Make this data dynamically available on the push of a scrape button at a later staget --- WIP
Data Source : All top 10 bitcoin analysis combined in one file
2. Latest Crypto Data ectracted from cryptocompare using API keys
Psuedocode :
1. Analysis :
1. Calculate the daily, monthly and yearly fluctuation in closing and opening price
2. Make this data dynamically available on the push of a scrape button at a later stage
3. Crypto Mining data retrieved from Coinwarz and cryptomarket to retrieve the mining difficulty and profitability ratio.
Merged the mining data in jupyter notebook using pandas in one file for the top 10 currencies by doing a left join in file (Merge_MiningData.ipynb). And then uploading the file onto Mongo DB Atlas. As MongoDb doesn't have the option of doing the join there, the join is done using pandas.

4. Schema of Merged collection on MongoDB Atlas

5. More data extracted from the following :
www.coingeico.com - Worldwide Crypto Exchanges data for exchanges data
www.cryptonews.com - sentiment score of news from 2020 to 2021
www.cryptocompare.com :
Hourly data extracted from for Time based Machine Learning Models.
Hashespersecond data for the coins extracted from www.cryptocompare.com to analyze the supply of cryptocurrencies.
News data for sentiment analysis extracted from www.cryptocompare.com
Social media daily stats
## Database Integration
This project required 2 databases due to large file sizes. Both databases store static data. For example, the databases store static csv files containing historical data for the cryptocurrencies and S&P 500. The database interfaces with the project through PyMongo. We use a MongoDB connection string to access databases and collections. A join was performed.
## Current Market Trends :
The current market data was retrieved from www.coinmarketcap.com using an API. The data was then sorted to display the top 10 currencies that week as per Market Cap
As per this week’s latest data Bitcoin and Ethereum are the top two coins with the highest market cap.
In the last 7 days period there has been a 5 percent increase in the price of both coins but the percentage dropped by 35% in the 90 day period


## Mining Analysis :
The data was retriewed using API keys from www.cryptocompare.com and from www.coinwarz.com. The mining data was for all coins and then the data was sorted on the most profitable coins and loss making coins for the purpose of visualizations.


## Social Media Analysis :
The social media analysis is the analysis of coinwise number of followers on twitter, facebook pages, cryptocompare news pages and reddit subscribers. This analysis was done to show how the number of followers has gone up by almost 50% in the past few years.

The below analysis was done to see which coin had more followers. Hence a pie chart was created, which represents that Bitcoin had 22% followers and Dogecoin had 24% followers. Doge coin followers could be more because of some followers of Elon Musk and his tweets about dogecoin.

## Sentiment Analysis:
For sentiment analysis news was retrieved from www.cryptocompare.com using API key.
The news was retrieved from 2016 to 2021 making it more than 300,000 rows of news.
The Polarity scores and sentiments were then analyzed for the news using TextBlob.
Polarity : Sentiment polarity for an element defines the orientation of the expressed sentiment, i.e., it determines if the text expresses the positive, negative or neutral sentiment of the user about the entity in consideration.
Sentiment : Is given in positive, negative or neutral.
Subjectivity : Subjective sentences generally refer to personal opinion, emotion or judgment whereas objective refers to factual information.
Below are the charts for the same... explaining the sentiment of the 10 coins over the years. Coins Tether and Cardono have shown increased positive sentiments in 2021.


## Close Price Volatility Analysis
### Technology Used
- MongoDB
- Google Colab
- PyMongo
- Python
- Pandas
- NumPy
- Matplotlib
### Cryptocurrencies Included in Analysis
10 Cryptocurrencies:
1. Binance Coin
2. Bitcoin
3. Cardano
4. Dogecoin
5. Ethereum
6. Litecoin
7. Monero
8. Stellar
9. Tether
10. XRP
+S&P 500 (for context/baseline)
### What is Volatility
Volatility is the annualized standard deviation. To annualize the standard deviation, you multiply it by the square root of the number of trading days in a year (253).
### Close Price Volatility Analysis
### Connecting to the Data (MongoDB)
The historical data for the 10 cryptocurrencies and the S&P500 was stored in the project's MongoDB database. The data was uploaded to the notebook using a MongoDB connection string. The data was then converted to a dataframe using Pandas.
### Filtering the Data for the Selected Years
The dataframe was filtered for the selected year - 2018, 2019, 2020 - respectively. The close price for the selected year was then visualized as a line graph.


### Calculating the Log Return
The NumPy library was used to calculate the daily log return. A new column was added to the selected year's dataframe showing the daily log return of the 'Close' price.
### Calculating the Annual Percent Volatility (2018-2020)
The volatility is defined as the annualized standard deviation. Thus the standard deviation of the daily log returns was multiplied by the square root of 253 to yield the volatility. The square root of 253 is used because there are approximately 253 trading days per year. The volatiltiy is then multiplied by 100% to get the **annual percent volatility**. The annual percent volatility was then visualized with a histogram using matplotlib.
Note: The S&P 500 was included in this analysis to provide context for the volatility of the 10 cryptocurrencies.


## Annual Percent Volatility from 2018-2020
All 10 cryptocurrencies and the S&P 500 annual percent volatility were visualized with a line graph. The line graph shows the annual percent volatility over a 3 year period, from 2018 to 2020, where each cryptocurrency and the S&P 500 is displayed with its own respective line.
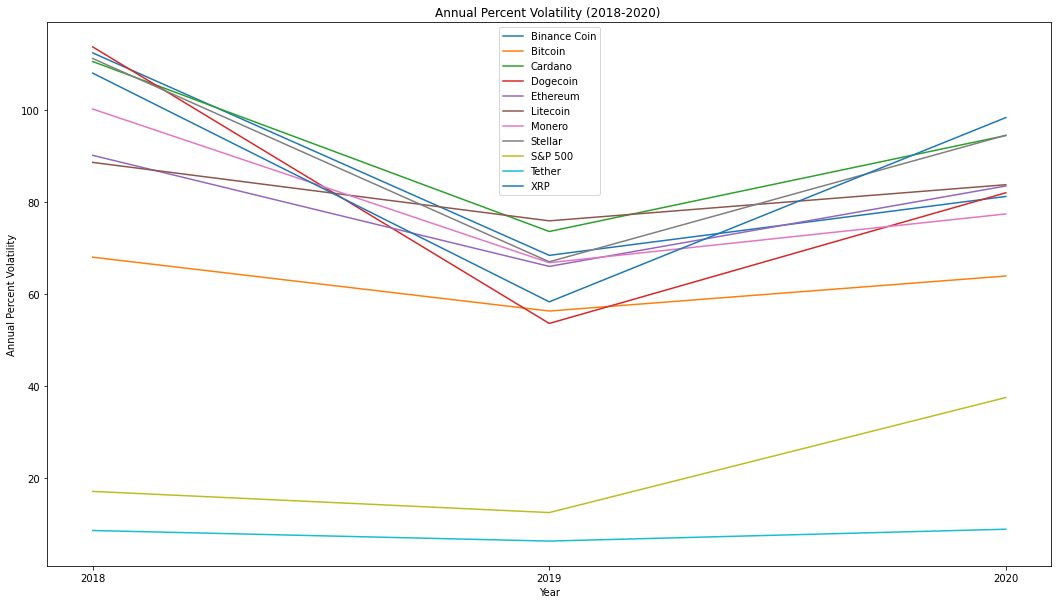
## Results
Please navigate to this [folder](https://github.com/LaviJ/Cryptocurrency-Analysis/tree/main/Volatility%20Analysis/VolatilityAnalysisCharts) to view all resulting charts.
#### Year 2018 Volatility
- Most stable cryptocurrency: Tether
- Most volatile cryptocurrency: Dogecoin
#### Year 2019 Volatility
- Most stable cryptocurrency: Tether
- Most volatile cryptocurrency: Litecoin
#### Year 2020 Volatility
- Most stable cryptocurrency: Tether
- Most volatile cryptocurrency: XRP
#### 3-Year Period (2018-2020) Volatility
- Most stable cryptocurrency: Tether
- Most volatile cryptocurrency: XRP
## Seasonality Analysis
### Prophet: How it Works (Description from Meta Research)
At its core, the Prophet procedure is an additive regression model with four main components:
1. A piecewise linear or logistic growth curve trend. Prophet automatically detects changes in trends by selecting changepoints from the data
2. A yearly season ... ...
近期下载者:
相关文件:
收藏者: