UCLA_Marine_Data_Visual
所属分类:GPS编程
开发工具:Python
文件大小:567KB
下载次数:0
上传日期:2018-09-17 22:46:11
上 传 者:
sh-1993
说明: 加州大学洛杉矶分校(UCLA)海洋数据可视化应用程序GUI正在以python开发,用于加州大学洛杉矶校区的海洋作业计划。我们...
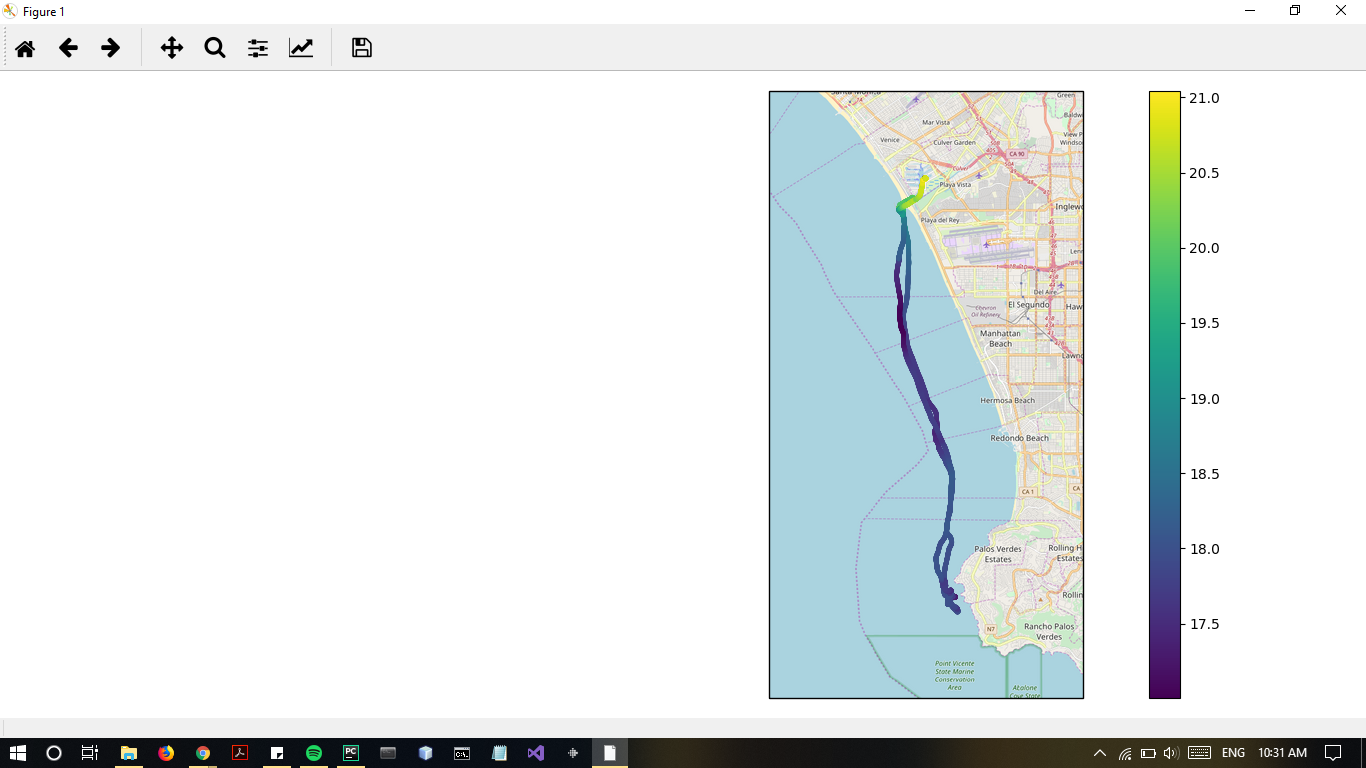
(UCLA Marine Data Visualization application/GUI in development in python for the Marine Operations Program at UCLA. Used to depict Ocean temperature along with GPS data ovelayed on a map. Check out the Marine Operations Program at: <https://dept.atmos.ucla.edu/marineops>)
文件列表:
Map_Visualization (0, 2018-09-18)
Map_Visualization\DataMapper.py (19788, 2018-09-18)
Map_Visualization\SampleData.txt (1137805, 2018-09-18)
Map_Visualization\main.py (82, 2018-09-18)
images_github (0, 2018-09-18)
images_github\datamapper2.png (285060, 2018-09-18)
images_github\logo.png (15962, 2018-09-18)

# UCLA_Marine_Data_Visual
[Work in progress, works fully but will be expanded] Data visualization application/GUI in development in python for the Marine Operations Program at UCLA. Used to depict Ocean temperature along with GPS data ovelayed on a map. Check out the UCLA Marine Operations Program for which this was developed at: https://dept.atmos.ucla.edu/marineops
## Setup
To setup your environment to run this program, you must first install the following python packages: matplotlib, and cartopy. If you already have any of these installed you can just skip this step. You can use whatever method you'd like to install these packages, but I'm just giving the method I used here. Be patient, as installing some of these packages can take some time. Everytime conda asks you to Proceed([y]/n)?, type in y (read the prompt it gives you and only follow this within reason). An internet connection is required for the setup.
1. Make sure you have python installed first
2. Install conda (specifically minoconda, although anaconda also works, it just takes longer to install and has unneeded packages) from https://conda.io/miniconda.html.
3. Open anaconda (do not close any pop ups while anaconda is being installed as this can cause issues)
4. Check that conda.exe and python.exe are installed. If the file locations are not returned, uninstall and reinstall anaconda.exe.
In anaconda:
```
where conda
where python
```
5. Set up your anaconda environment. If you aren't running python 3.6, use whatever version you have (although you may want to update it).
```
conda create -n name_of_environment python=3.5
```
It will ask you to active the environment, in which case you must input:
```
conda activate name_of_environment
```
(to deactive an active environment, type in: conda deactivate).
6. Install cartopy
```
conda install -c conda-forge cartopy
```
7. Install an updated version of numpy
```
conda install numpy
```
8. You can now close anaconda.
## Running the program
1. Put main.py, DataMapper.py, and SampleData.txt in the same file
2. Open up command prompt, powershell, or terminal and navigate to the folder all the above programs are located in (should work using the cd command)
3. Make sure you have an internet connection. This application downloads map data from online servers.
4. Run the code with:
```
py main.py
```
GUI (example displays GPS and salinity):
## Other Notes
At the present the code only works with the format used in SampleData.txt. I intend to make it more general purpose so that any combination of GPS data x any other data type can be used. This is a simple fixes that will be improved upon shortly.
Admittedly, there are a lot of steps involved with setting up your environment to run this program, but it allows for the most rapid development of this software.
### Acknowledgements:
This program was built based on matplotlib: https://matplotlib.org/users/installing.html#install-requirements, and cartopy: https://scitools.org.uk/cartopy/docs/latest/index.html
近期下载者:
相关文件:
收藏者: