Mapping_Earthquakes
说明: 使用Leaflet.js应用程序编程接口(API)用GeoJSON地震数据填充地理地图...
(Use the Leaflet.js Application Programming Interface (API) to populate a geographical map with GeoJSON earthquake data from a URL)
(Use the Leaflet.js Application Programming Interface (API) to populate a geographical map with GeoJSON earthquake data from a URL)
文件列表:
Earthquake_Challenge (0, 2022-05-02)
Earthquake_Challenge\index.html (1473, 2022-05-02)
Earthquake_Challenge\static (0, 2022-05-02)
Earthquake_Challenge\static\css (0, 2022-05-02)
Earthquake_Challenge\static\css\style (1, 2022-05-02)
Earthquake_Challenge\static\css\style.css (290, 2022-05-02)
Earthquake_Challenge\static\js (0, 2022-05-02)
Earthquake_Challenge\static\js\challenge_logic.js (8073, 2022-05-02)
Earthquake_Challenge\static\js\config.js (127, 2022-05-02)
Earthquake_Challenge\static\js\logic.js (1788, 2022-05-02)
Simple_Map (0, 2022-05-02)
Simple_Map\index.html (1101, 2022-05-02)
Simple_Map\static (0, 2022-05-02)
Simple_Map\static\css (0, 2022-05-02)
Simple_Map\static\css\style.css (82, 2022-05-02)
Simple_Map\static\js (0, 2022-05-02)
Simple_Map\static\js\config.js (127, 2022-05-02)
Simple_Map\static\js\logic.js (768, 2022-05-02)
majorAirports.json (10272, 2022-05-02)
torontoNeighborhoods.json (1972831, 2022-05-02)
torontoRoutes.json (45033, 2022-05-02)
# Mapping_Earthquakes
use the `Leaflet.js` Application Programming Interface (API) to populate a geographical map with GeoJSON earthquake data from a URL
## Overview
Basil and Sadhana like how you created your earthquake map with two different maps and the earthquake overlay. Now, Basil and Sadhana would like to see the earthquake data in relation to the tectonic plates location on the earth, and they would like to see all the earthquakes with a magnitude greater than 4.5 on the map, and they would like to see the data on a third map.
## Deliverable 1
**Requirements:**
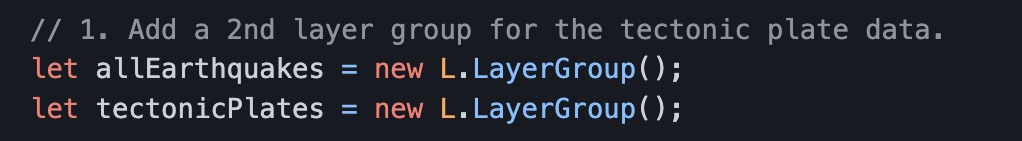
1. The tectonic plate data is added as a second layer group.
2. The tectonic plate data is added to the overlay object.
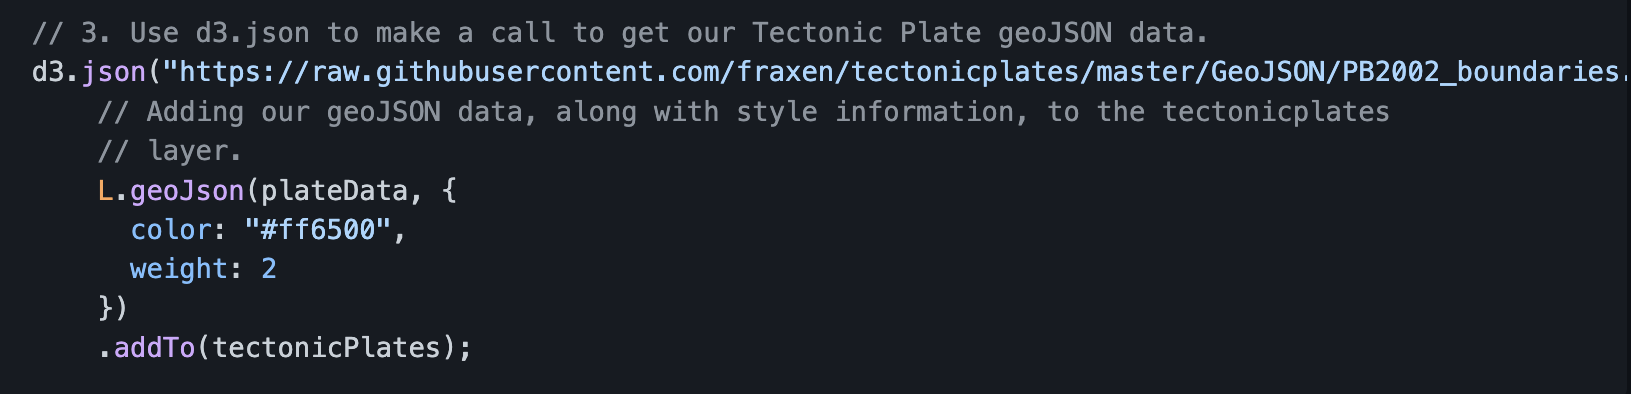
3. The `d3.json()` callback is working and does the following:
* The tectonic plate data is passed to the `geoJSON()` layer
* The geoJSON() layer adds color and width to the tectonic plate lines
* The tectonic layer group variable is added to the map
4. The earthquake data and tectonic plate data displayed on the map when the page loads.
**Results with Pictures:**

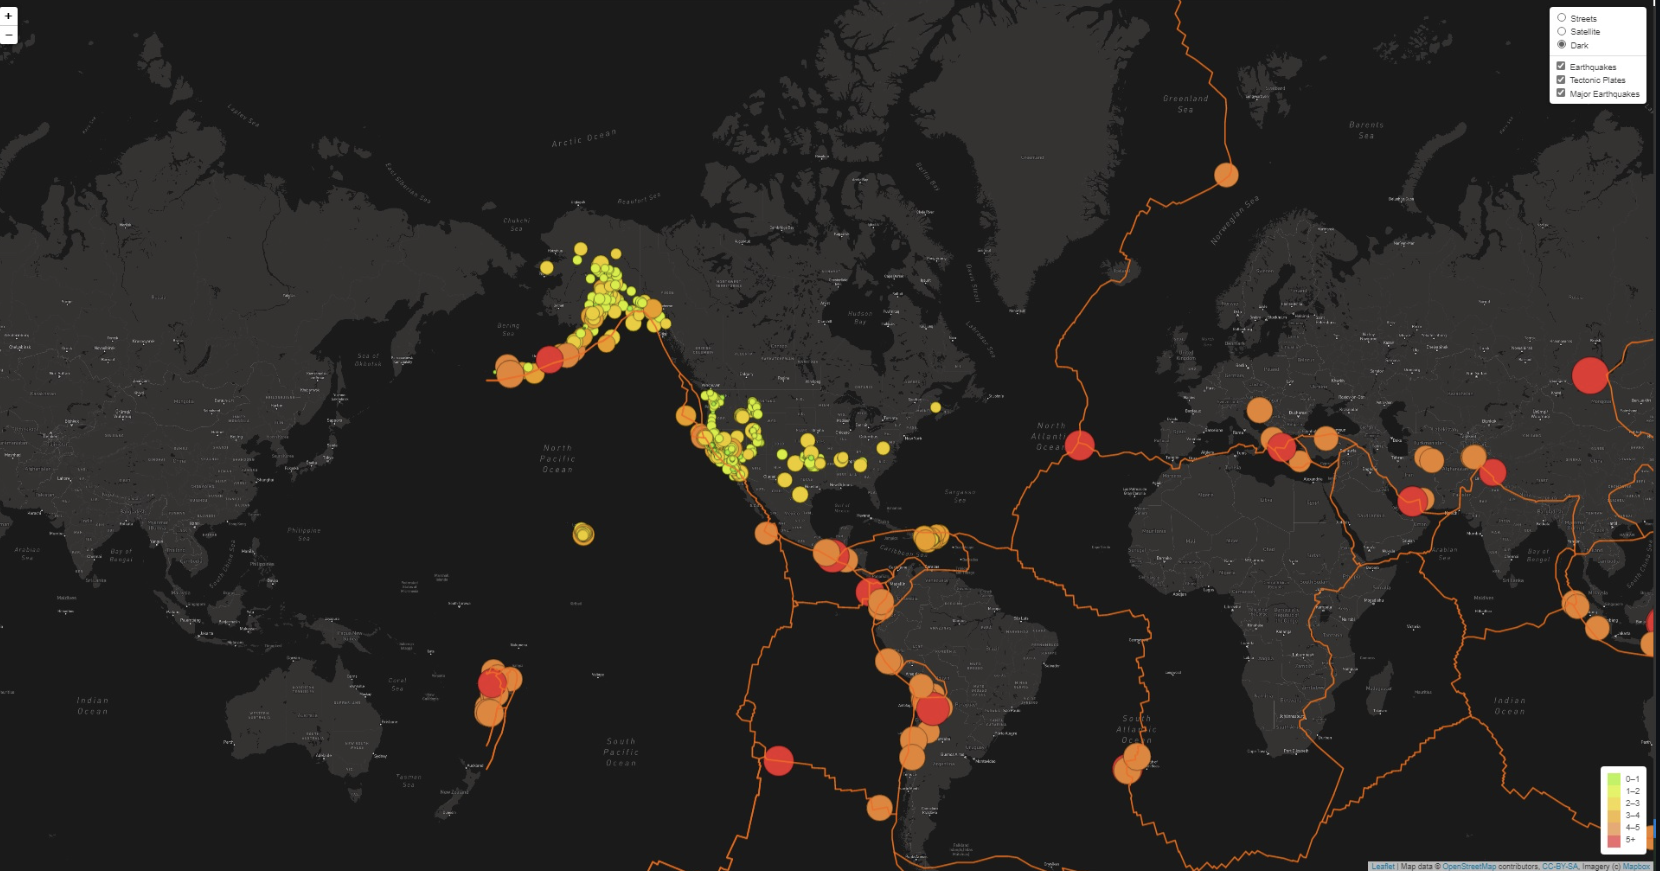
 ## Deliverable 2
**Requirements:**
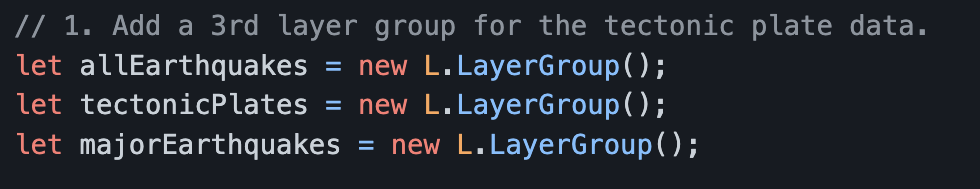
1. The major earthquake data is added as a third layer group.
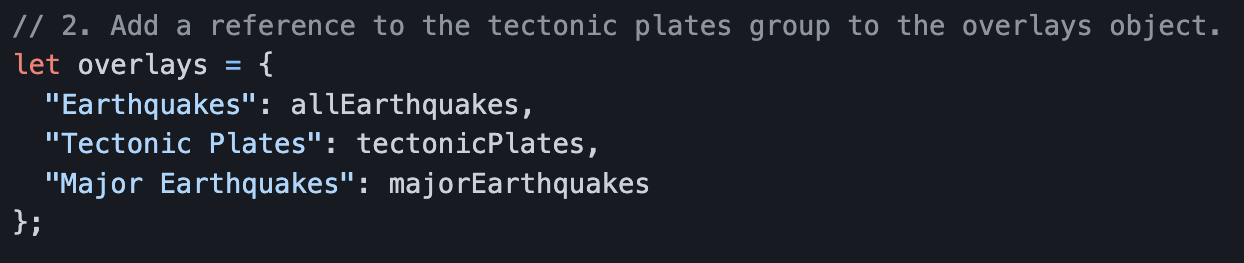
2. The major earthquake data is added to the overlay object.
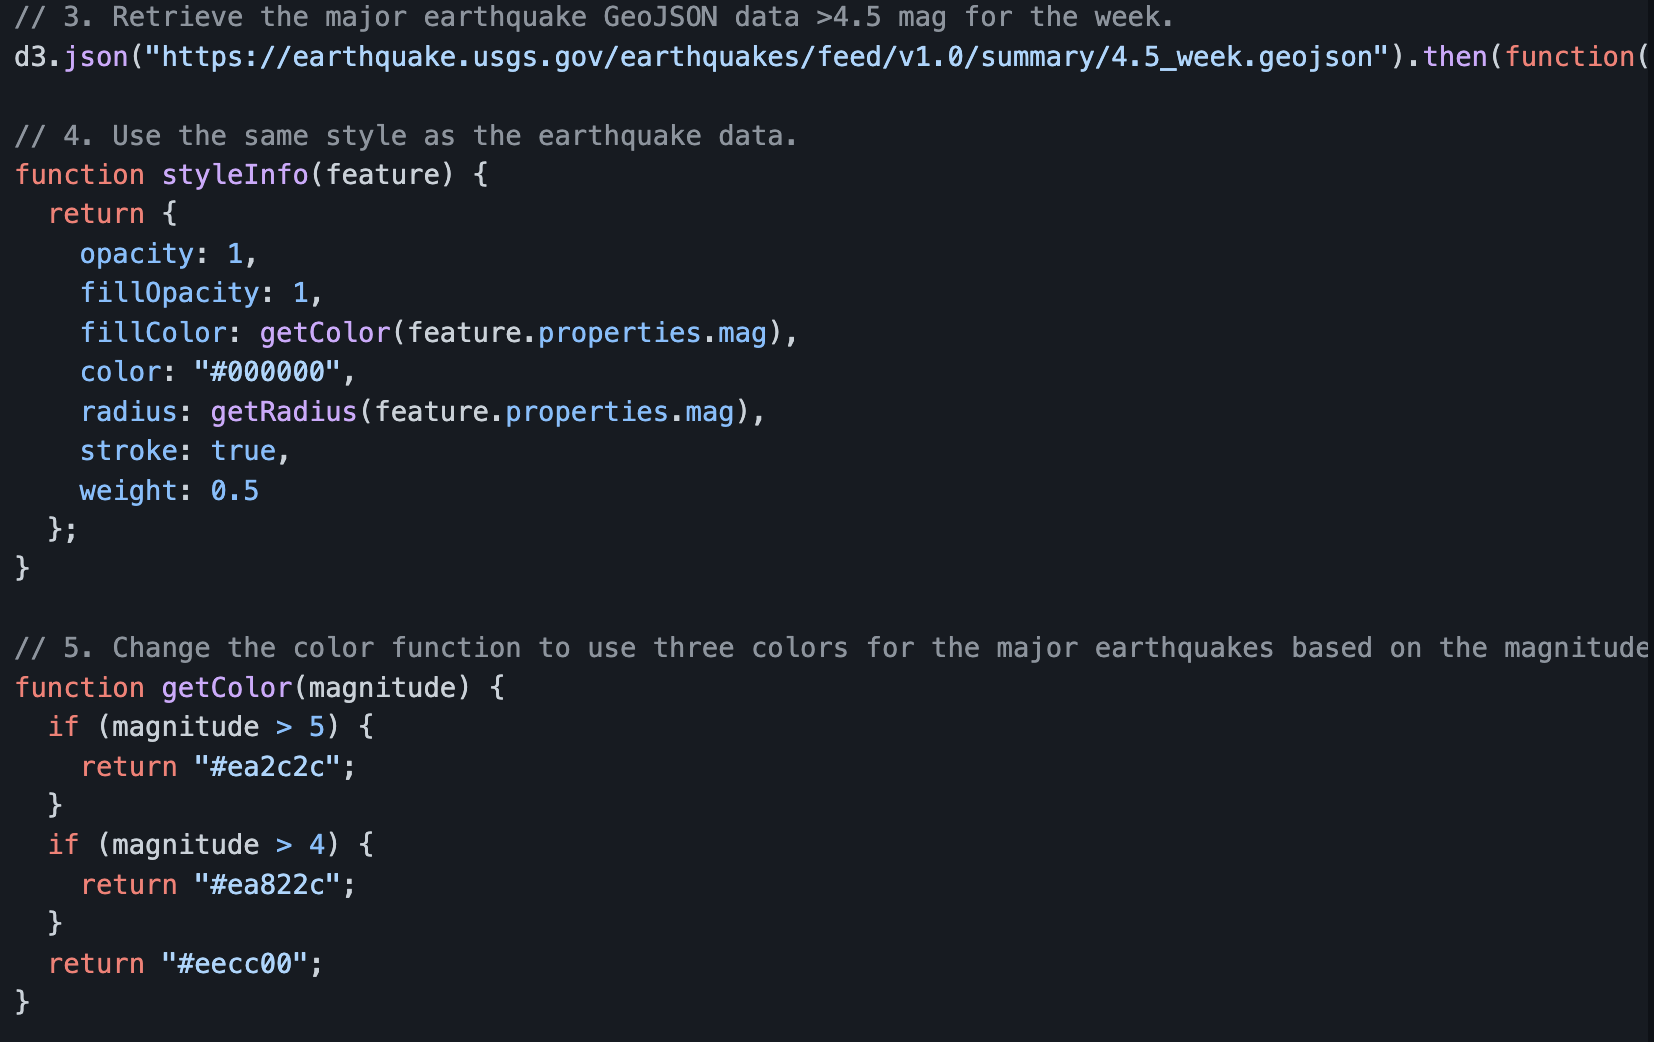
3. The `d3.json()` callback is working and does the following:
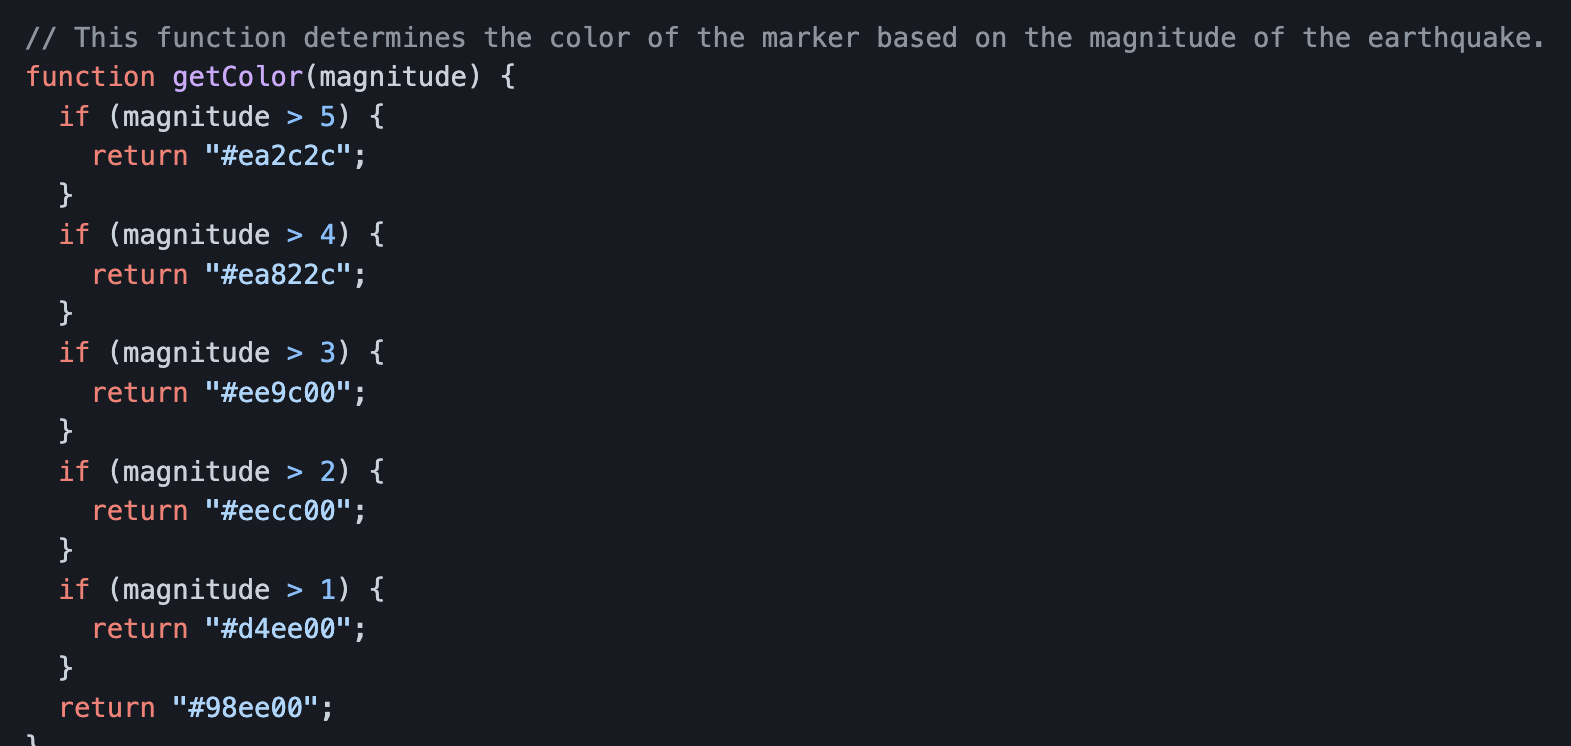
* Sets the color and diameter of each earthquake.
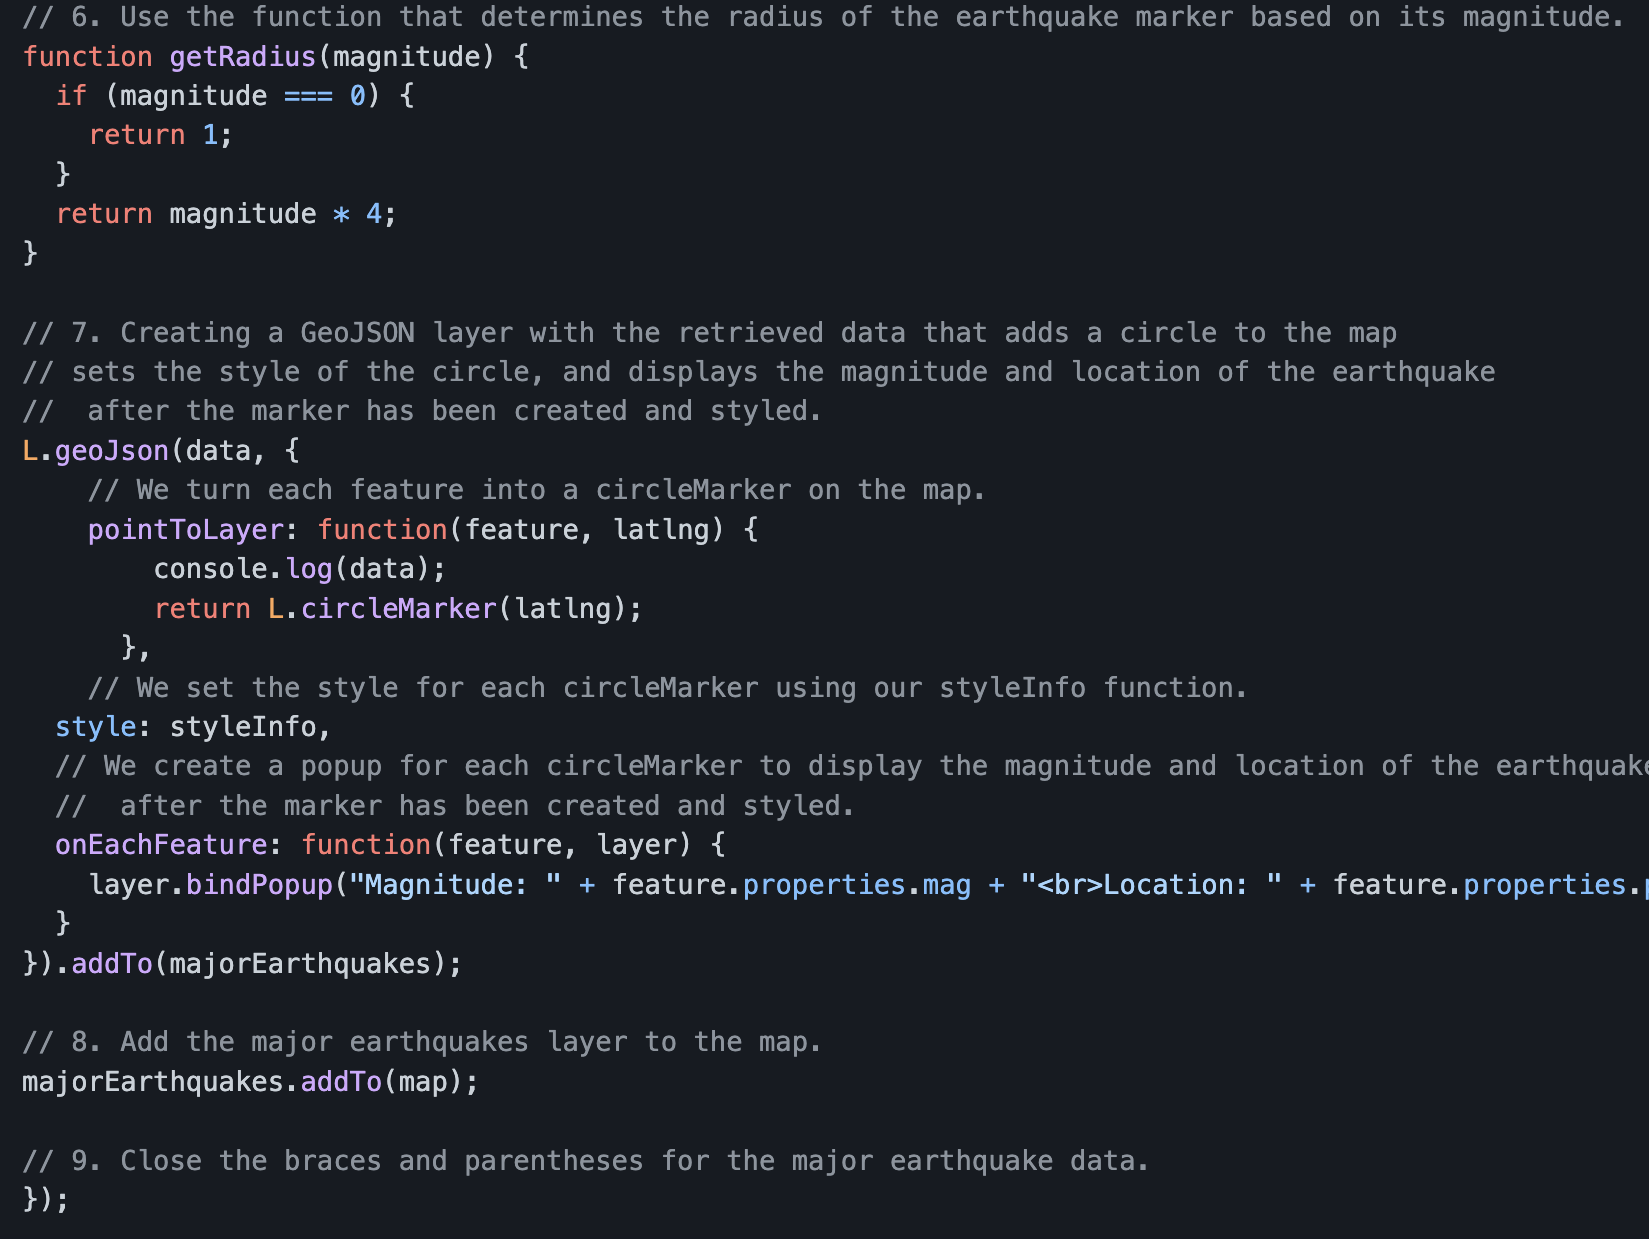
* The major earthquake data is passed to the geoJSON() layer.
* The `geoJSON()` layer creates a circle for each major earthquake, and adds a popup for each circle to display the magnitude and location of the earthquake
* The major earthquake layer group variable is added to the map
4. All the earthquake data and tectonic plate data are displayed on the map when the page loads and the datasets can be toggled on or off.
**Results with Pictures:**
## Deliverable 2
**Requirements:**
1. The major earthquake data is added as a third layer group.
2. The major earthquake data is added to the overlay object.
3. The `d3.json()` callback is working and does the following:
* Sets the color and diameter of each earthquake.
* The major earthquake data is passed to the geoJSON() layer.
* The `geoJSON()` layer creates a circle for each major earthquake, and adds a popup for each circle to display the magnitude and location of the earthquake
* The major earthquake layer group variable is added to the map
4. All the earthquake data and tectonic plate data are displayed on the map when the page loads and the datasets can be toggled on or off.
**Results with Pictures:**
 ## Deliverable 3
**Requirements:**
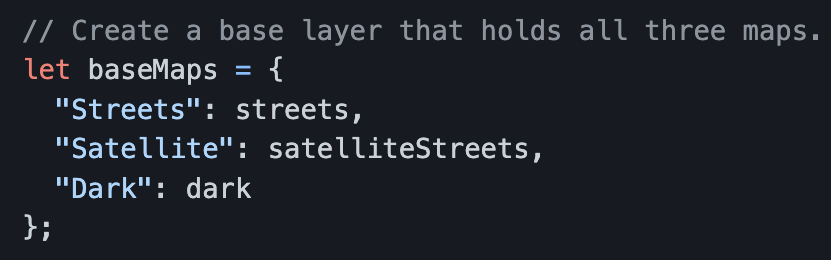
1. A third map tile layer is created.
2. The third map is added to the overlay object.
3. All the earthquake data and tectonic plate data are displayed on the all maps of the webpage.
**Results with Pictures:**
## Deliverable 3
**Requirements:**
1. A third map tile layer is created.
2. The third map is added to the overlay object.
3. All the earthquake data and tectonic plate data are displayed on the all maps of the webpage.
**Results with Pictures:**
 > LinkedIn: https://www.linkedin.com/in/wilson-alexei/
> Email: wils.alexei@gmail.com
> LinkedIn: https://www.linkedin.com/in/wilson-alexei/
> Email: wils.alexei@gmail.com
## Deliverable 2
**Requirements:**
1. The major earthquake data is added as a third layer group.
2. The major earthquake data is added to the overlay object.
3. The `d3.json()` callback is working and does the following:
* Sets the color and diameter of each earthquake.
* The major earthquake data is passed to the geoJSON() layer.
* The `geoJSON()` layer creates a circle for each major earthquake, and adds a popup for each circle to display the magnitude and location of the earthquake
* The major earthquake layer group variable is added to the map
4. All the earthquake data and tectonic plate data are displayed on the map when the page loads and the datasets can be toggled on or off.
**Results with Pictures:**
## Deliverable 3
**Requirements:**
1. A third map tile layer is created.
2. The third map is added to the overlay object.
3. All the earthquake data and tectonic plate data are displayed on the all maps of the webpage.
**Results with Pictures:**
> LinkedIn: https://www.linkedin.com/in/wilson-alexei/
> Email: wils.alexei@gmail.com
近期下载者:
相关文件:
收藏者: