Waiting_for_Mark
所属分类:R语言
开发工具:R
文件大小:0KB
下载次数:0
上传日期:2021-07-08 05:25:27
上 传 者:
sh-1993
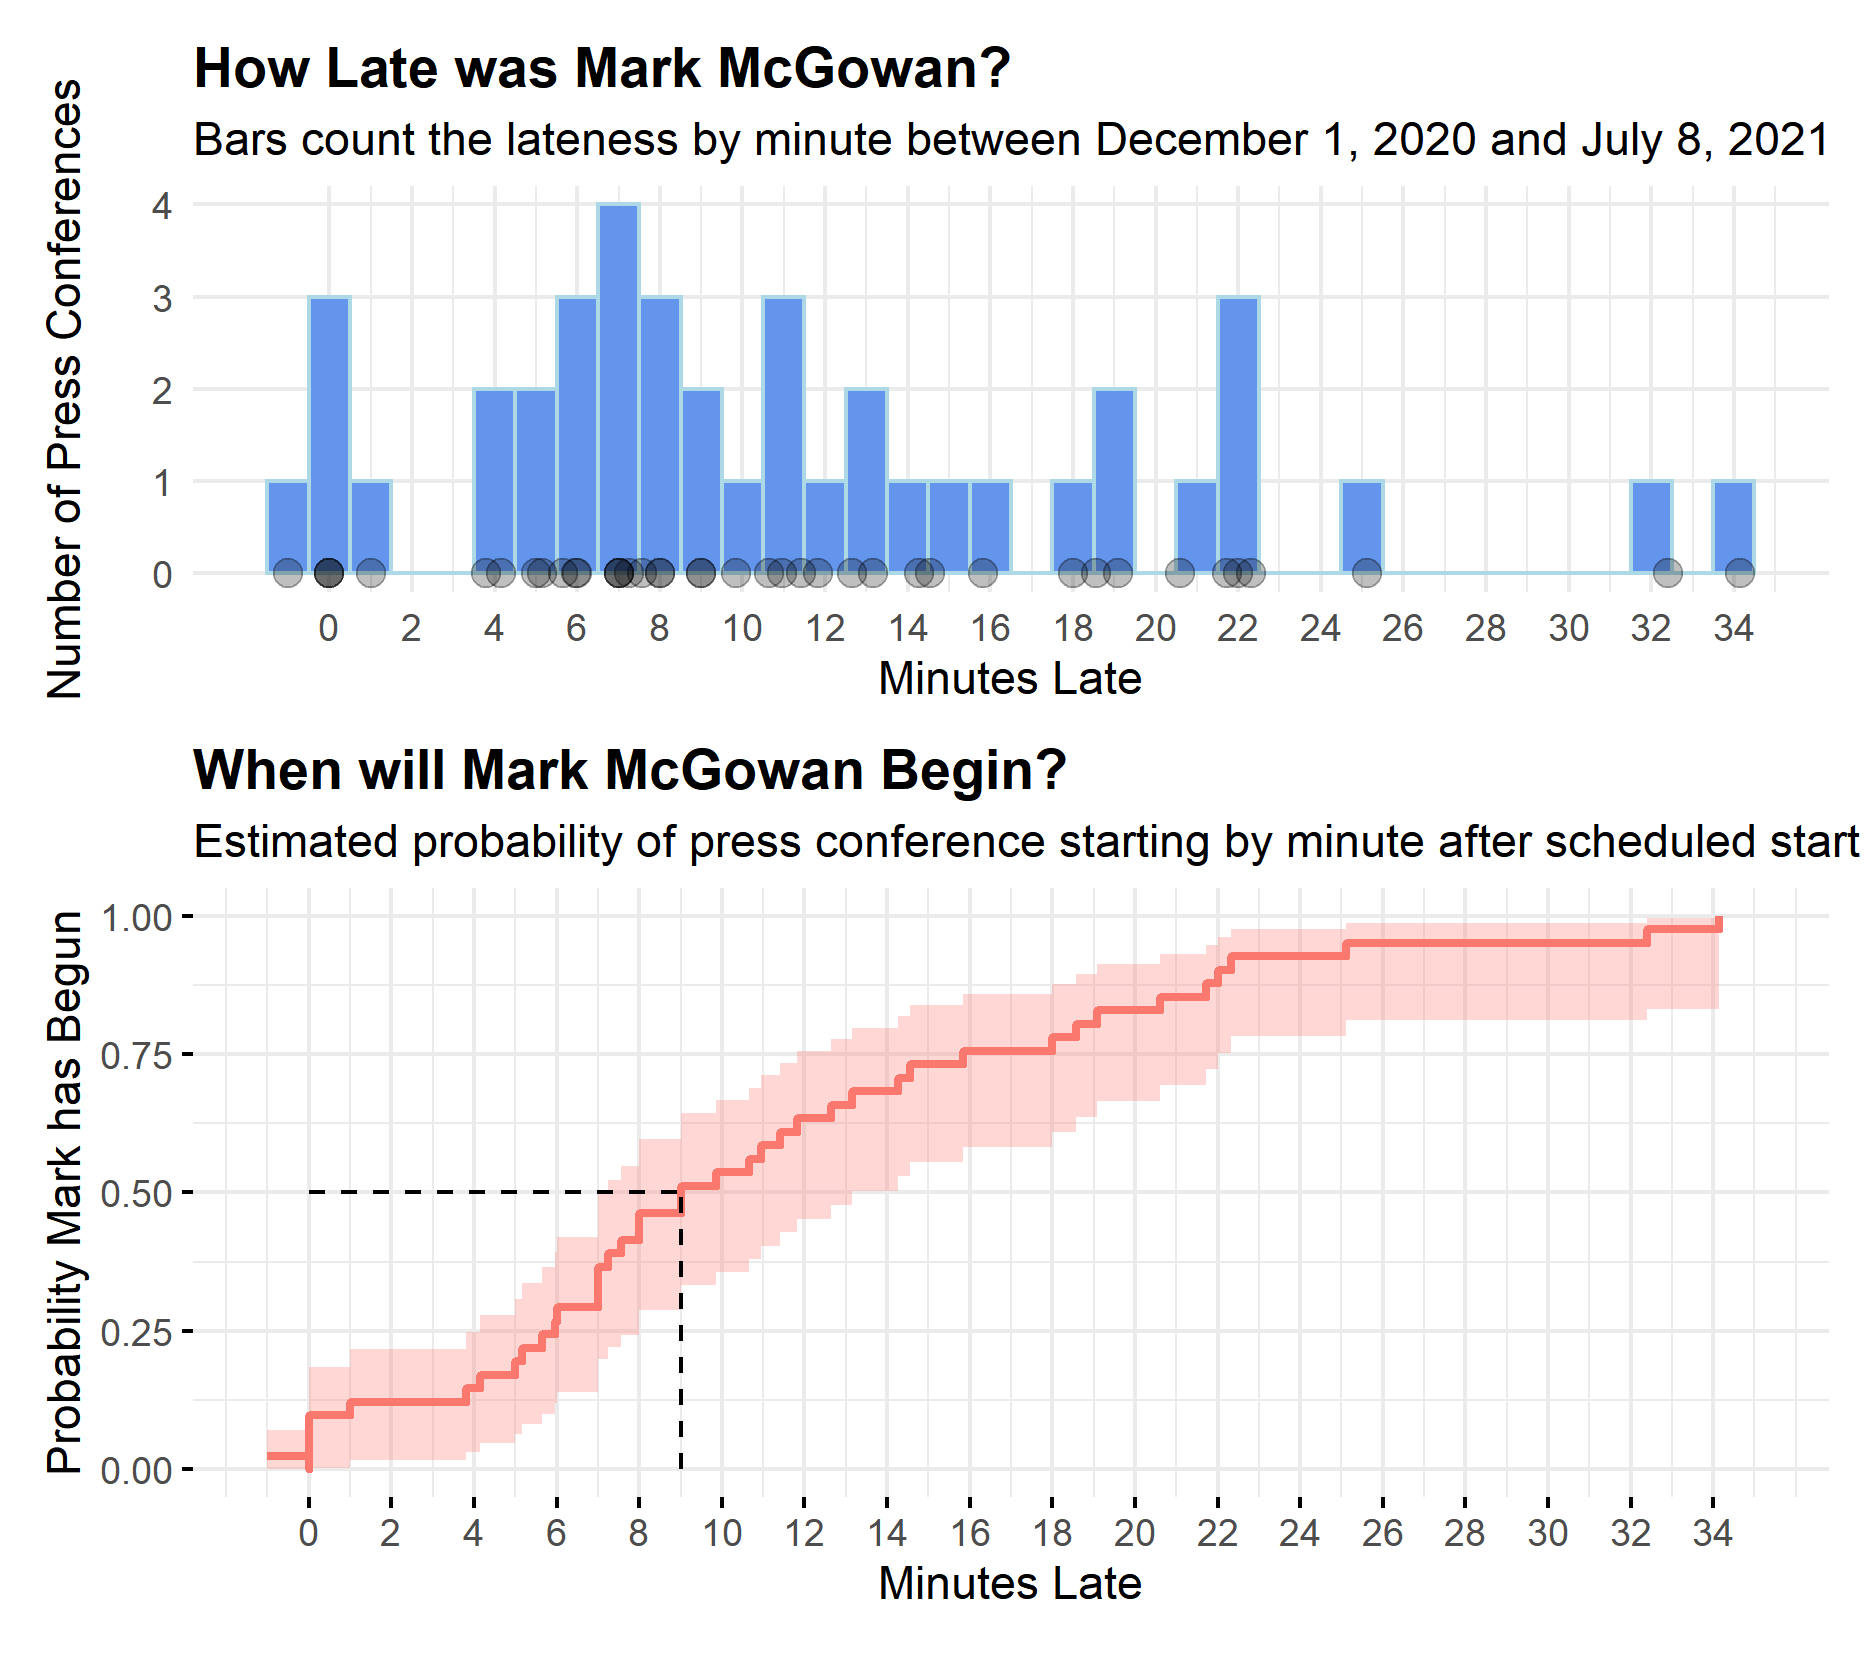
说明: 分析Mark McGowan新闻发布会的计划开始时间和实际开始时间之间的差异
(Analysing differences between scheduled and actual start times for Mark McGowan press conferences)
文件列表:
LICENSE (7048, 2021-07-07)
analysis/ (0, 2021-07-07)
analysis/infographic_2021-07-04/ (0, 2021-07-07)
analysis/infographic_2021-07-04/infographic.png (483791, 2021-07-07)
analysis/infographic_2021-07-04/lateness_infographic.pptx (184814, 2021-07-07)
analysis/lateness_analysis.R (2346, 2021-07-07)
analysis/lateness_plots.pdf (9219, 2021-07-07)
analysis/lateness_plots.png (70515, 2021-07-07)
data/ (0, 2021-07-07)
data/facebook_data.csv (2013, 2021-07-07)
data/mmg_times.csv (206, 2021-07-07)
data/mmg_times.rds (1602, 2021-07-07)
data/youtube_data.json (3528, 2021-07-07)
scripts/ (0, 2021-07-07)
scripts/livestream_data.py (1206, 2021-07-07)
scripts/livestream_wrangling.R (724, 2021-07-07)
# Waiting for Mark
Github repo for analysing differences between scheduled and actual start times for Western Australia Premier Mark McGowan press conferences between December 1 2020 and July 8 2021.
Any additional data or data analysis welcome, just open a PR!
## Notes:
Data from the ABC News Youtube channel was scraped using the Youtube API; see the `livestream_data.py` file. A few amendments were made where the [@whattimemark](https://twitter.com/WhatTimeMark) twitter account provided an official scheduled time that differed to the time scheduled by the ABC News Youtube team. These are documented in the `livestream_wrangling.R` file.
Data from the ABC News Perth Facebook videos were input manually as the livestreams varied on whether the broadcast started when Mark began or beforehand (i.e., the broadcasting start time did not necessarily reflect the time Mark arrived).
Kaplan-Meier curve estimation and visualisation was conducted using the `survival` and `survminer` packages for R, respectively. The dates were formatted nicely using `lubridate`.
近期下载者:
相关文件:
收藏者: