PIL_GraphicsEngine
说明: 一个完全从头开始构建的2D 3D图形引擎,使用我非常有限的光栅渲染知识和Python Image Library(PIL),
(A 2D 3D graphics engine built entirely from scratch, using my very limited knowledge of raster rendering and the Python Image Library (PIL),)
(A 2D 3D graphics engine built entirely from scratch, using my very limited knowledge of raster rendering and the Python Image Library (PIL),)
文件列表:
LICENSE (35149, 2023-06-17)
PILGE_demo1.gif (8896421, 2023-06-17)
__init__.py (307, 2023-06-17)
dev_test.py (111, 2023-06-17)
engine_functions.py (9284, 2023-06-17)
main.py (1980, 2023-06-17)
primitives/ (0, 2023-06-17)
primitives/Cube.txt (298, 2023-06-17)
primitives/Dodecahedron.txt (515, 2023-06-17)
primitives/Rabbit.txt (16217, 2023-06-17)
primitives/Torus.txt (13241, 2023-06-17)
# PIL_GraphicsEngine
A 2D/3D graphics engine built entirely from scratch, using my very limited knowledge of raster rendering and the Python Image Library (PIL)
I don't usually use github, or make my code public but I want a way to easily manage my code and thought that maybe someone else could use it too.
So feel free to take it if you want, make it run faster or something - as long as you keep it open source I won't mind
Please don't judge, I'm doing this for fun
# Demo
 # How to use
1. Extract the repository
2. Install these dependencies (if you don't have them already):
- `pip install numpy`
- `pip install numba`
- `pip install pillow`
3. Edit the `engine_cycle` function to display what you want *(optional)*
4. Run main.py
# Functionalities
At any given moment, whatever is displayed for every frame is dictated by the "engine_cycle" function that's located in main.py.
You can animate things in code using the `frame` variable. It acts as an ever-incrementing clock counter.
To switch the 3D mesh that is displayed by the `draw_wireframe` funtion, change the filename at the end of `main.py`. You can choose among the models in the primitives folder:
- `Cube.txt`
- `Dodecahedron.txt` (default)
- `Torus.txt`
### There are a few functions that can be used to manipulate the engine:
- You can change the color of any pixel on the screen by editing the `draw_frame(arr, frame)` function.
```
arr[x,y] = [255, 255, 255] # this line decides about the RGB color of a given x,y pixel
```
---------------------------------------------------------
- `draw_line(arr, start_coors, end_coors, color)` will draw a line given a startpoint, endpoint and color.
At this moment in time lines don't have any thickness (they have a constant thickness of 1px).
arr: *the img object converted to an array*
start_coors, end_coors: ``[x, y]`` - *a 2 element list or tuple with values that belong to the canvas*
color: ``[r, g, b]`` - *a 3 element list or tuple with 3 values between 0 and 255 that represent red, green and blue*
**Example:** `draw_line(img, [256, 100], [123, 15], (255, 6, 181))`
---------------------------------------------------------
- `draw_wireframe(arr, vertex_table, edge_table, color)` will draw a 2D projection of a previously imported mesh as a wireframe.
arr: *the img object converted to an array*
vertex_table: *a table that contains the coordinates of every vertex of a mesh*
edge_table: *a table that contains the coonnections between vertices for every edge of a mesh*
color: ``[r, g, b]`` - *a 3 element list or tuple with 3 values between 0 and 255 that represent red, green and blue*
**Example:** `img = draw_wireframe(arr, rotated_table, edge_table, (40, 255, 125))`
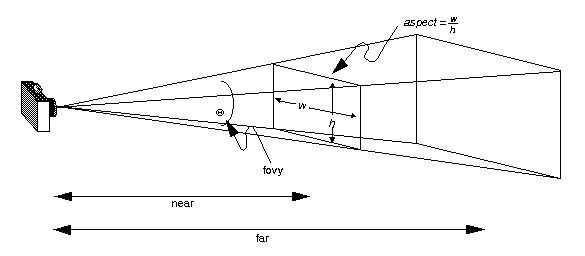
**Inside of the function, you can change a few key variables that control the shape of the viewing frustum (which controls what gets actually rendered):**
`fovy`: The angle between the upper and lower sides of the viewing frustum
`near`: Number Distance to the near clipping plane along the -Z axis
`far`: Number Distance to the far clipping plane along the -Z axis
# How to use
1. Extract the repository
2. Install these dependencies (if you don't have them already):
- `pip install numpy`
- `pip install numba`
- `pip install pillow`
3. Edit the `engine_cycle` function to display what you want *(optional)*
4. Run main.py
# Functionalities
At any given moment, whatever is displayed for every frame is dictated by the "engine_cycle" function that's located in main.py.
You can animate things in code using the `frame` variable. It acts as an ever-incrementing clock counter.
To switch the 3D mesh that is displayed by the `draw_wireframe` funtion, change the filename at the end of `main.py`. You can choose among the models in the primitives folder:
- `Cube.txt`
- `Dodecahedron.txt` (default)
- `Torus.txt`
### There are a few functions that can be used to manipulate the engine:
- You can change the color of any pixel on the screen by editing the `draw_frame(arr, frame)` function.
```
arr[x,y] = [255, 255, 255] # this line decides about the RGB color of a given x,y pixel
```
---------------------------------------------------------
- `draw_line(arr, start_coors, end_coors, color)` will draw a line given a startpoint, endpoint and color.
At this moment in time lines don't have any thickness (they have a constant thickness of 1px).
arr: *the img object converted to an array*
start_coors, end_coors: ``[x, y]`` - *a 2 element list or tuple with values that belong to the canvas*
color: ``[r, g, b]`` - *a 3 element list or tuple with 3 values between 0 and 255 that represent red, green and blue*
**Example:** `draw_line(img, [256, 100], [123, 15], (255, 6, 181))`
---------------------------------------------------------
- `draw_wireframe(arr, vertex_table, edge_table, color)` will draw a 2D projection of a previously imported mesh as a wireframe.
arr: *the img object converted to an array*
vertex_table: *a table that contains the coordinates of every vertex of a mesh*
edge_table: *a table that contains the coonnections between vertices for every edge of a mesh*
color: ``[r, g, b]`` - *a 3 element list or tuple with 3 values between 0 and 255 that represent red, green and blue*
**Example:** `img = draw_wireframe(arr, rotated_table, edge_table, (40, 255, 125))`
**Inside of the function, you can change a few key variables that control the shape of the viewing frustum (which controls what gets actually rendered):**
`fovy`: The angle between the upper and lower sides of the viewing frustum
`near`: Number Distance to the near clipping plane along the -Z axis
`far`: Number Distance to the far clipping plane along the -Z axis
 ---------------------------------------------------------
- `import_model(filepath)` will return both a vertex table and an edge table for any given file in the correct format.
filepath: *a path to a text file containing the data*
**Example:** `vertex_table, edge_table = import_model("primitives/Torus.txt")`
--------------------------------------------------------
- `rotate_mesh(vertex_table, angle)` given a vertex table, it returns another that is rotated on the vertical axis by a specified angle.
vertex_table: *a table that contains the coordinates of every vertex of a mesh*
angle: *an angle value in radians*
**Example:** `rotated_table = rotate_mesh(vertex_table, math.radians(60))`
------------------------------------------------------
**Important!** *in order for some functions to run on the GPU, they require the image to be an array for the input. Then it needs to be converted back to an image.*
**This is already done by default**
------------------------------------------------------
- `dist(p1, p2)` given two points, it returns the distance between them.
**Example:** `dist([0, 0], [42, 66])`
------------------------------------------------------
- `step(threshold, val)` if the value is above or equal to a certain thereshold, it returns 1 - otherwise it returns 0.
**Example:** `step(3, 6)`
------------------------------------------------------
- `smoothstep(low, high, val)` Works the same as with the function above, but with two thresholds and the outputs transition between 0 and 1 is smooth. The points where it fully becomes either 0 or 1 are specified by the low and high values.
**Example:** `smoothstep(3, 12, 6)`
------------------------------------------------------
- `clamp (val, low, high)` Clamps the value between low and high. If the value is lower than low, it will always return low. If it's higher than high, it returns high.
This way the value is forced to always stay between those specified low and high numbers.
**Example:** `clamp (0, 1, 0.56)`
------------------------------------------------------
---------------------------------------------------------
- `import_model(filepath)` will return both a vertex table and an edge table for any given file in the correct format.
filepath: *a path to a text file containing the data*
**Example:** `vertex_table, edge_table = import_model("primitives/Torus.txt")`
--------------------------------------------------------
- `rotate_mesh(vertex_table, angle)` given a vertex table, it returns another that is rotated on the vertical axis by a specified angle.
vertex_table: *a table that contains the coordinates of every vertex of a mesh*
angle: *an angle value in radians*
**Example:** `rotated_table = rotate_mesh(vertex_table, math.radians(60))`
------------------------------------------------------
**Important!** *in order for some functions to run on the GPU, they require the image to be an array for the input. Then it needs to be converted back to an image.*
**This is already done by default**
------------------------------------------------------
- `dist(p1, p2)` given two points, it returns the distance between them.
**Example:** `dist([0, 0], [42, 66])`
------------------------------------------------------
- `step(threshold, val)` if the value is above or equal to a certain thereshold, it returns 1 - otherwise it returns 0.
**Example:** `step(3, 6)`
------------------------------------------------------
- `smoothstep(low, high, val)` Works the same as with the function above, but with two thresholds and the outputs transition between 0 and 1 is smooth. The points where it fully becomes either 0 or 1 are specified by the low and high values.
**Example:** `smoothstep(3, 12, 6)`
------------------------------------------------------
- `clamp (val, low, high)` Clamps the value between low and high. If the value is lower than low, it will always return low. If it's higher than high, it returns high.
This way the value is forced to always stay between those specified low and high numbers.
**Example:** `clamp (0, 1, 0.56)`
------------------------------------------------------
# How to use
1. Extract the repository
2. Install these dependencies (if you don't have them already):
- `pip install numpy`
- `pip install numba`
- `pip install pillow`
3. Edit the `engine_cycle` function to display what you want *(optional)*
4. Run main.py
# Functionalities
At any given moment, whatever is displayed for every frame is dictated by the "engine_cycle" function that's located in main.py.
You can animate things in code using the `frame` variable. It acts as an ever-incrementing clock counter.
To switch the 3D mesh that is displayed by the `draw_wireframe` funtion, change the filename at the end of `main.py`. You can choose among the models in the primitives folder:
- `Cube.txt`
- `Dodecahedron.txt` (default)
- `Torus.txt`
### There are a few functions that can be used to manipulate the engine:
- You can change the color of any pixel on the screen by editing the `draw_frame(arr, frame)` function.
```
arr[x,y] = [255, 255, 255] # this line decides about the RGB color of a given x,y pixel
```
---------------------------------------------------------
- `draw_line(arr, start_coors, end_coors, color)` will draw a line given a startpoint, endpoint and color.
At this moment in time lines don't have any thickness (they have a constant thickness of 1px).
arr: *the img object converted to an array*
start_coors, end_coors: ``[x, y]`` - *a 2 element list or tuple with values that belong to the canvas*
color: ``[r, g, b]`` - *a 3 element list or tuple with 3 values between 0 and 255 that represent red, green and blue*
**Example:** `draw_line(img, [256, 100], [123, 15], (255, 6, 181))`
---------------------------------------------------------
- `draw_wireframe(arr, vertex_table, edge_table, color)` will draw a 2D projection of a previously imported mesh as a wireframe.
arr: *the img object converted to an array*
vertex_table: *a table that contains the coordinates of every vertex of a mesh*
edge_table: *a table that contains the coonnections between vertices for every edge of a mesh*
color: ``[r, g, b]`` - *a 3 element list or tuple with 3 values between 0 and 255 that represent red, green and blue*
**Example:** `img = draw_wireframe(arr, rotated_table, edge_table, (40, 255, 125))`
**Inside of the function, you can change a few key variables that control the shape of the viewing frustum (which controls what gets actually rendered):**
`fovy`: The angle between the upper and lower sides of the viewing frustum
`near`: Number Distance to the near clipping plane along the -Z axis
`far`: Number Distance to the far clipping plane along the -Z axis
---------------------------------------------------------
- `import_model(filepath)` will return both a vertex table and an edge table for any given file in the correct format.
filepath: *a path to a text file containing the data*
**Example:** `vertex_table, edge_table = import_model("primitives/Torus.txt")`
--------------------------------------------------------
- `rotate_mesh(vertex_table, angle)` given a vertex table, it returns another that is rotated on the vertical axis by a specified angle.
vertex_table: *a table that contains the coordinates of every vertex of a mesh*
angle: *an angle value in radians*
**Example:** `rotated_table = rotate_mesh(vertex_table, math.radians(60))`
------------------------------------------------------
**Important!** *in order for some functions to run on the GPU, they require the image to be an array for the input. Then it needs to be converted back to an image.*
**This is already done by default**
------------------------------------------------------
- `dist(p1, p2)` given two points, it returns the distance between them.
**Example:** `dist([0, 0], [42, 66])`
------------------------------------------------------
- `step(threshold, val)` if the value is above or equal to a certain thereshold, it returns 1 - otherwise it returns 0.
**Example:** `step(3, 6)`
------------------------------------------------------
- `smoothstep(low, high, val)` Works the same as with the function above, but with two thresholds and the outputs transition between 0 and 1 is smooth. The points where it fully becomes either 0 or 1 are specified by the low and high values.
**Example:** `smoothstep(3, 12, 6)`
------------------------------------------------------
- `clamp (val, low, high)` Clamps the value between low and high. If the value is lower than low, it will always return low. If it's higher than high, it returns high.
This way the value is forced to always stay between those specified low and high numbers.
**Example:** `clamp (0, 1, 0.56)`
------------------------------------------------------
近期下载者:
相关文件:
收藏者: