FUNDING.yml (182, 2023-08-06)
LICENSE.txt (1056, 2023-08-06)
docs/ (0, 2023-08-06)
docs/img/ (0, 2023-08-06)
docs/img/01_circ.svg (372, 2023-08-06)
docs/img/01_ellip.svg (384, 2023-08-06)
docs/img/01_line.svg (238, 2023-08-06)
docs/img/01_multilines.svg (264, 2023-08-06)
docs/img/01_multilines2.svg (406, 2023-08-06)
docs/img/01_polygon.svg (272, 2023-08-06)
docs/img/01_rect.svg (567, 2023-08-06)
docs/img/01_rectround.svg (634, 2023-08-06)
docs/img/02_dash.svg (449, 2023-08-06)
docs/img/02_foso.svg (1010, 2023-08-06)
docs/img/02_fsc.svg (509, 2023-08-06)
docs/img/02_join.svg (471, 2023-08-06)
docs/img/02_linecap.svg (527, 2023-08-06)
docs/img/02_mlimit.svg (469, 2023-08-06)
docs/img/02_strokewdth.svg (1407, 2023-08-06)
docs/img/03_pA.svg (516, 2023-08-06)
docs/img/03_pC.svg (2094, 2023-08-06)
docs/img/03_pHV.svg (305, 2023-08-06)
docs/img/03_pL.svg (349, 2023-08-06)
docs/img/03_pQ.svg (762, 2023-08-06)
docs/img/03_pS.svg (706, 2023-08-06)
docs/img/03_pT.svg (406, 2023-08-06)
docs/img/03_pZ.svg (312, 2023-08-06)
docs/img/04_align.svg (796, 2023-08-06)
docs/img/04_fill.svg (798, 2023-08-06)
docs/img/04_fonts1.png (10753, 2023-08-06)
docs/img/04_fonts2.png (12227, 2023-08-06)
docs/img/04_len.svg (781, 2023-08-06)
docs/img/04_multiline_text.svg (714, 2023-08-06)
docs/img/04_mutiline_text.svg (714, 2023-08-06)
docs/img/04_path.svg (1490, 2023-08-06)
docs/img/04_rot.svg (368, 2023-08-06)
docs/img/04_rot2.svg (355, 2023-08-06)
docs/img/04_tspan.svg (379, 2023-08-06)
... ...
[](https://github.com/cduck/drawSvg/blob/master/examples/logo.svg)
A Python 3 library for programmatically generating SVG images and animations that can render and display your drawings in a Jupyter notebook or Jupyter lab.
Most common SVG tags are supported and others can easily be added by writing a small subclass of `DrawableBasicElement` or `DrawableParentElement`. [Nearly all SVG attributes](https://developer.mozilla.org/en-US/docs/Web/SVG) are supported via keyword args (e.g. Python keyword argument `fill_opacity=0.5` becomes SVG attribute `fill-opacity="0.5"`).
An interactive [Jupyter notebook](https://jupyter.org) widget, `drawsvg.widgets.DrawingWidget`, [is included](#interactive-widget) that can update drawings based on mouse events. The widget does not yet work in Jupyter lab.
[SVG quick reference docs](https://cduck.github.io/drawsvg/)
# Install
Drawsvg is available on PyPI:
```bash
$ python3 -m pip install "drawsvg~=2.0"
```
To enable raster image support (PNG, MP4, and GIF), follow the [full-feature install instructions](#full-feature-install).
## Upgrading from version 1.x
Major breaking changes:
- camelCase method and argument names are now snake\_case and the package name is lowercase (except for arguments that correspond to camelCase SVG attributes).
- The default coordinate system y-axis now matches the SVG coordinate system (y increases down the screen, x increases right)
- How to fix `ModuleNotFoundError: No module named 'drawSvg'` (with a capital S)? Either pip install `"drawSvg~=1.9"` or update your code for drawsvg 2.x (for example, change `drawSvg` to `drawsvg` and `d.saveSvg` to `d.save_svg`).
# Examples
### Basic drawing elements
```python
import drawsvg as draw
d = draw.Drawing(200, 100, origin='center')
# Draw an irregular polygon
d.append(draw.Lines(-80, 45,
70, 49,
95, -49,
-90, -40,
close=False,
fill='#eeee00',
stroke='black'))
# Draw a rectangle
r = draw.Rectangle(-80, -50, 40, 50, fill='#1248ff')
r.append_title("Our first rectangle") # Add a tooltip
d.append(r)
# Draw a circle
d.append(draw.Circle(-40, 10, 30,
fill='red', stroke_width=2, stroke='black'))
# Draw an arbitrary path (a triangle in this case)
p = draw.Path(stroke_width=2, stroke='lime', fill='black', fill_opacity=0.2)
p.M(-10, -20) # Start path at point (-10, -20)
p.C(30, 10, 30, -50, 70, -20) # Draw a curve to (70, -20)
d.append(p)
# Draw text
d.append(draw.Text('Basic text', 8, -10, -35, fill='blue')) # 8pt text at (-10, -35)
d.append(draw.Text('Path text', 8, path=p, text_anchor='start', line_height=1))
d.append(draw.Text(['Multi-line', 'text'], 8, path=p, text_anchor='end', center=True))
# Draw multiple circular arcs
d.append(draw.ArcLine(60, 20, 20, 60, 270,
stroke='red', stroke_width=5, fill='red', fill_opacity=0.2))
d.append(draw.Arc(60, 20, 20, 90, -60, cw=True,
stroke='green', stroke_width=3, fill='none'))
d.append(draw.Arc(60, 20, 20, -60, 90, cw=False,
stroke='blue', stroke_width=1, fill='black', fill_opacity=0.3))
# Draw arrows
arrow = draw.Marker(-0.1, -0.51, 0.9, 0.5, scale=4, orient='auto')
arrow.append(draw.Lines(-0.1, 0.5, -0.1, -0.5, 0.9, 0, fill='red', close=True))
p = draw.Path(stroke='red', stroke_width=2, fill='none',
marker_end=arrow) # Add an arrow to the end of a path
p.M(20, 40).L(20, 27).L(0, 20) # Chain multiple path commands
d.append(p)
d.append(draw.Line(30, 20, 0, 10,
stroke='red', stroke_width=2, fill='none',
marker_end=arrow)) # Add an arrow to the end of a line
d.set_pixel_scale(2) # Set number of pixels per geometry unit
#d.set_render_size(400, 200) # Alternative to set_pixel_scale
d.save_svg('example.svg')
d.save_png('example.png')
# Display in Jupyter notebook
#d.rasterize() # Display as PNG
d # Display as SVG
```
[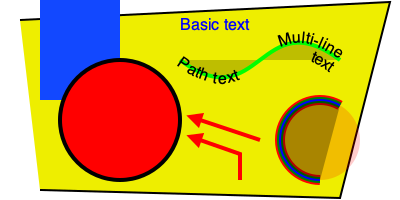](https://github.com/cduck/drawsvg/blob/master/examples/example1.svg)
### SVG-native animation with playback controls
```python
import drawsvg as draw
d = draw.Drawing(400, 200, origin='center',
animation_config=draw.types.SyncedAnimationConfig(
# Animation configuration
duration=8, # Seconds
show_playback_progress=True,
show_playback_controls=True))
d.append(draw.Rectangle(-200, -100, 400, 200, fill='#eee')) # Background
d.append(draw.Circle(0, 0, 40, fill='green')) # Center circle
# Animation
circle = draw.Circle(0, 0, 0, fill='gray') # Moving circle
circle.add_key_frame(0, cx=-100, cy=0, r=0)
circle.add_key_frame(2, cx=0, cy=-100, r=40)
circle.add_key_frame(4, cx=100, cy=0, r=0)
circle.add_key_frame(6, cx=0, cy=100, r=40)
circle.add_key_frame(8, cx=-100, cy=0, r=0)
d.append(circle)
r = draw.Rectangle(0, 0, 0, 0, fill='silver') # Moving square
r.add_key_frame(0, x=-100, y=0, width=0, height=0)
r.add_key_frame(2, x=0-20, y=-100-20, width=40, height=40)
r.add_key_frame(4, x=100, y=0, width=0, height=0)
r.add_key_frame(6, x=0-20, y=100-20, width=40, height=40)
r.add_key_frame(8, x=-100, y=0, width=0, height=0)
d.append(r)
# Changing text
draw.native_animation.animate_text_sequence(
d,
[0, 2, 4, 6],
['0', '1', '2', '3'],
30, 0, 1, fill='yellow', center=True)
# Save as a standalone animated SVG or HTML
d.save_svg('playback-controls.svg')
d.save_html('playback-controls.html')
# Display in Jupyter notebook
#d.display_image() # Display SVG as an image (will not be interactive)
#d.display_iframe() # Display as interactive SVG (alternative)
#d.as_gif('orbit.gif', fps=10) # Render as a GIF image, optionally save to file
#d.as_mp4('orbig.mp4', fps=60, verbose=True) # Render as an MP4 video, optionally save to file
#d.as_spritesheet('orbit-spritesheet.png', row_length=10, fps=3) # Render as a spritesheet
d.display_inline() # Display as interactive SVG
```
[](https://github.com/cduck/drawsvg/blob/master/examples/playback-controls.svg)
Note: GitHub blocks the playback controls.
Download the above SVG and open it in a web browser to try.
https://user-images.githubusercontent.com/2476062/221400434-1529d237-e9bf-4363-a143-0ece75cd349a.mp4
### Patterns and gradients
```python
import drawsvg as draw
d = draw.Drawing(1.5, 0.8, origin='center')
# Background pattern (not supported by Cairo, d.rasterize() will not show it)
pattern = draw.Pattern(width=0.13, height=0.23)
pattern.append(draw.Rectangle(0, 0, .1, .1, fill='yellow'))
pattern.append(draw.Rectangle(0, .1, .1, .1, fill='orange'))
d.draw(draw.Rectangle(-0.75, -0.5, 1.5, 1, fill=pattern, fill_opacity=0.4))
# Create gradient
gradient = draw.RadialGradient(0, 0.35, 0.7*10)
gradient.add_stop(0.5/0.7/10, 'green', 1)
gradient.add_stop(1/10, 'red', 0)
# Draw a shape to fill with the gradient
p = draw.Path(fill=gradient, stroke='black', stroke_width=0.002)
p.arc(0, 0.35, 0.7, -30, -120, cw=False)
p.arc(0, 0.35, 0.5, -120, -30, cw=True, include_l=True)
p.Z()
d.append(p)
# Draw another shape to fill with the same gradient
p = draw.Path(fill=gradient, stroke='red', stroke_width=0.002)
p.arc(0, 0.35, 0.75, -130, -160, cw=False)
p.arc(0, 0.35, 0, -160, -130, cw=True, include_l=True)
p.Z()
d.append(p)
# Another gradient
gradient2 = draw.LinearGradient(0.1, 0.35, 0.1+0.6, 0.35+0.2)
gradient2.add_stop(0, 'green', 1)
gradient2.add_stop(1, 'red', 0)
d.append(draw.Rectangle(0.1, 0.15, 0.6, 0.2,
stroke='black', stroke_width=0.002,
fill=gradient2))
# Display
d.set_render_size(w=600)
d
```
[](https://github.com/cduck/drawsvg/blob/master/examples/example2.svg)
### Duplicate geometry and clip paths
```python
import drawsvg as draw
d = draw.Drawing(1.4, 1.4, origin='center')
# Define clip path
clip = draw.ClipPath()
clip.append(draw.Rectangle(-.25, -.25, 1, 1))
# Draw a cropped circle
circle = draw.Circle(0, 0, 0.5,
stroke_width='0.01', stroke='black',
fill_opacity=0.3, clip_path=clip)
d.append(circle)
# Make a transparent copy, cropped again
g = draw.Group(opacity=0.5, clip_path=clip)
# Here, circle is not directly appended to the drawing.
# drawsvg recognizes that `Use` references `circle` and automatically adds
# `circle` to the
section of the SVG.
g.append(draw.Use(circle, 0.25, -0.1))
d.append(g)
# Display
d.set_render_size(400)
#d.rasterize() # Display as PNG
d # Display as SVG
```
[](https://github.com/cduck/drawsvg/blob/master/examples/example3.svg)
### Organizing and duplicating drawing elements
```python
import drawsvg as draw
d = draw.Drawing(300, 100)
d.set_pixel_scale(2)
# Use groups to contain other elements
# Children elements of groups inherit the coordinate system (transform)
# and attribute values
group = draw.Group(fill='orange', transform='rotate(-20)')
group.append(draw.Rectangle(0, 10, 20, 40)) # This rectangle will be orange
group.append(draw.Circle(30, 40, 10)) # This circle will also be orange
group.append(draw.Circle(50, 40, 10, fill='green')) # This circle will not
d.append(group)
# Use the Use element to make duplicates of elements
# Each duplicate can be placed at an offset (x, y) location and any additional
# attributes (like fill color) are inherited if the element didn't specify them.
d.append(draw.Use(group, 80, 0, stroke='black', stroke_width=1))
d.append(draw.Use(group, 80, 20, stroke='blue', stroke_width=2))
d.append(draw.Use(group, 80, 40, stroke='red', stroke_width=3))
d.display_inline()
```
[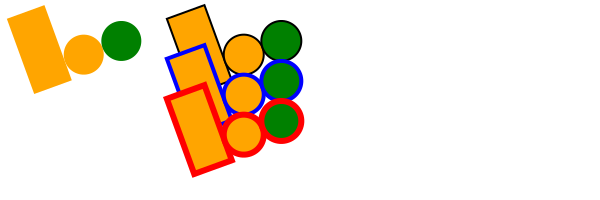](https://github.com/cduck/drawsvg/blob/master/examples/example8.svg)
### Implementing other SVG tags
```python
import drawsvg as draw
# Subclass DrawingBasicElement if it cannot have child nodes
# Subclass DrawingParentElement otherwise
# Subclass DrawingDef if it must go between
tags in an SVG
class Hyperlink(draw.DrawingParentElement):
TAG_NAME = 'a'
def __init__(self, href, target=None, **kwargs):
# Other init logic...
# Keyword arguments to super().__init__() correspond to SVG node
# arguments: stroke_width=5 ->
...
super().__init__(href=href, target=target, **kwargs)
d = draw.Drawing(1, 1.2, origin='center')
# Create hyperlink
hlink = Hyperlink('https://www.python.org', target='_blank',
transform='skewY(-30)')
# Add child elements
hlink.append(draw.Circle(0, 0, 0.5, fill='green'))
hlink.append(draw.Text('Hyperlink', 0.2, 0, 0, center=0.6, fill='white'))
# Draw and display
d.append(hlink)
d.set_render_size(200)
d
```
[](https://github.com/cduck/drawsvg/blob/master/examples/example4.svg)
### Animation with the SVG Animate Tag
```python
import drawsvg as draw
d = draw.Drawing(200, 200, origin='center')
# Animate the position and color of circle
c = draw.Circle(0, 0, 20, fill='red')
# See for supported attributes:
# https://developer.mozilla.org/en-US/docs/Web/SVG/Element/animate
c.append_anim(draw.Animate('cy', '6s', '-80;80;-80',
repeatCount='indefinite'))
c.append_anim(draw.Animate('cx', '6s', '0;80;0;-80;0',
repeatCount='indefinite'))
c.append_anim(draw.Animate('fill', '6s', 'red;green;blue;yellow',
calc_mode='discrete',
repeatCount='indefinite'))
d.append(c)
# Animate a black circle around an ellipse
ellipse = draw.Path()
ellipse.M(-90, 0)
ellipse.A(90, 40, 360, True, True, 90, 0) # Ellipse path
ellipse.A(90, 40, 360, True, True, -90, 0)
ellipse.Z()
c2 = draw.Circle(0, 0, 10)
# See for supported attributes:
# https://developer.mozilla.org/en-US/docs/Web/SVG/Element/animate_motion
c2.append_anim(draw.AnimateMotion(ellipse, '3s',
repeatCount='indefinite'))
# See for supported attributes:
# https://developer.mozilla.org/en-US/docs/Web/SVG/Element/animate_transform
c2.append_anim(draw.AnimateTransform('scale', '3s', '1,2;2,1;1,2;2,1;1,2',
repeatCount='indefinite'))
d.append(c2)
d.save_svg('animated.svg') # Save to file
d # Display in Jupyter notebook
```
[](https://github.com/cduck/drawsvg/blob/master/examples/animated.svg)
### Interactive Widget
```python
import drawsvg as draw
from drawsvg.widgets import DrawingWidget
import hyperbolic.poincare as hyper # python3 -m pip install hyperbolic
from hyperbolic import euclid
# Create drawing
d = draw.Drawing(2, 2, origin='center', context=draw.Context(invert_y=True))
d.set_render_size(500)
d.append(draw.Circle(0, 0, 1, fill='orange'))
group = draw.Group()
d.append(group)
# Update the drawing based on user input
click_list = []
def redraw(points):
group.children.clear()
for x1, y1 in points:
for x2, y2 in points:
if (x1, y1) == (x2, y2): continue
p1 = hyper.Point.from_euclid(x1, y1)
p2 = hyper.Point.from_euclid(x2, y2)
if p1.distance_to(p2) <= 2:
line = hyper.Line.from_points(*p1, *p2, segment=True)
group.draw(line, hwidth=0.2, fill='white')
for x, y in points:
p = hyper.Point.from_euclid(x, y)
group.draw(hyper.Circle.from_center_radius(p, 0.1),
fill='green')
redraw(click_list)
# Create interactive widget and register mouse events
widget = DrawingWidget(d)
@widget.mousedown
def mousedown(widget, x, y, info):
if (x**2 + y**2) ** 0.5 + 1e-5 < 1:
click_list.append((x, y))
redraw(click_list)
widget.refresh()
@widget.mousemove
def mousemove(widget, x, y, info):
if (x**2 + y**2) ** 0.5 + 1e-5 < 1:
redraw(click_list + [(x, y)])
widget.refresh()
widget
```
Note: The above example currently only works in `jupyter notebook`, not `jupyter lab`.
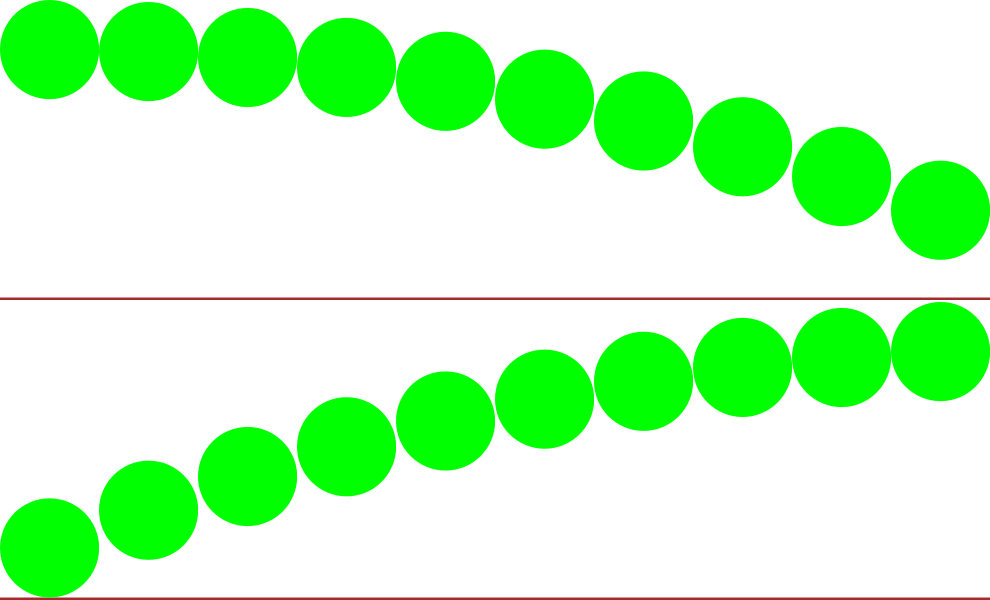
### Frame-by-Frame Animation
```python
import drawsvg as draw
# Draw a frame of the animation
def draw_frame(t):
d = draw.Drawing(2, 6.05, origin=(-1, -5))
d.set_render_size(h=300)
d.append(draw.Rectangle(-2, -6, 4, 8, fill='white'))
d.append(draw.Rectangle(-1, 1, 2, 0.05, fill='brown'))
t = (t + 1) % 2 - 1
y = t**2 * 4 - 4
d.append(draw.Circle(0, y, 1, fill='lime'))
return d
with draw.frame_animate_jupyter(draw_frame, delay=0.05) as anim:
# Or:
#with draw.frame_animate_video('example6.gif', draw_frame, duration=0.05) as anim:
# Or:
#with draw.frame_animate_spritesheet('example6.png', draw_frame, row_length=10) as anim:
# Add each frame to the animation
for i in range(20):
anim.draw_frame(i/10)
for i in range(20):
anim.draw_frame(i/10)
for i in range(20):
anim.draw_frame(i/10)
```
GIF:

Spritesheet (usable in most 2D game engines):
### Asynchronous Frame-based Animation in Jupyter
```python
# Jupyter cell 1:
import drawsvg as draw
from drawsvg.widgets import AsyncAnimation
widget = AsyncAnimation(fps=10)
widget
# [Animation is displayed here (click to pause)]
# Jupyter cell 2:
global_variable = 'a'
@widget.set_draw_frame # Animation above is automatically updated
def draw_frame(secs=0):
# Draw something...
d = draw.Drawing(100, 40)
d.append(draw.Text(global_variable, 20, 0, 30))
d.append(draw.Text('{:0.1f}'.format(secs), 20, 30, 30))
return d
# Jupyter cell 3:
global_variable = 'b' # Animation above now displays 'b'
```

Note: The above example currently only works in `jupyter notebook`, not `jupyter lab`.
### Embed custom fonts
```python
import drawsvg as draw
d = draw.Drawing(400, 100, origin='center')
d.embed_google_font('Permanent Marker', text=set('Text with custom font'))
d.append(draw.Text('Text with custom font', 35, 0, 0, center=True,
font_family='Permanent Marker', font_style='italic'))
d.save_svg('font.svg')
d # Custom fonts work in most browsers but not in rasterize(), save_png(), or save_video()
```
[](https://github.com/cduck/drawsvg/blob/master/examples/font.svg)
---
# Full-feature install
Drawsvg may be either be installed with no dependencies (only SVG and SVG-native animation will work):
```bash
$ python3 -m pip install "drawsvg~=2.0"
```
Or drawsvg may be installed with extra dependencies to support PNG, MP4, and GIF output:
```bash
$ python3 -m pip install "drawsvg[all]~=2.0"
```
An additional required package, [Cairo](https://www.cairographics.org/download/), cannot be installed with pip and must be installed separately. When Cairo is installed, drawsvg can output PNG and other image formats in addition to SVG. Install it with your preferred package manager. Examples:
**Ubuntu**
```bash
$ sudo apt install libcairo2
```
**macOS**
Using [homebrew](https://brew.sh/) (may require a Python version installed with `brew install python`):
```bash
$ brew install cairo
```
**Any platform**
Using [Anaconda](https://docs.conda.io/en/latest/miniconda.html) (may require Python and cairo installed in the same conda environment):
```bash
$ conda install -c anaconda cairo
```